

This is a longer and more in-depth version of my recent Aporia article. Fair warning: we’ll be getting into the weeds. If you want the tl;dr, drop a pity-like here and go to the shorter version. If you do read to the end, congratulations! This article may be dense, but you, dear reader, are not :)
The notion that you will be stupider tomorrow than you are today is extremely unsettling. We would all like to believe that the longer we live, the more information we can absorb, the more our brains develop, and the smarter we become. Sadly, the question is not if, but when cognitive decline begins.
Most studies agree that the different components of intelligence may peak at different ages: fluid intelligence, which reflects one’s problem-solving ability, sequential reasoning, and cognitive agility, seems to decline earlier than crystallised intelligence, which reflects the accumulation and deployment of knowledge. However, when exactly the peaks in both fluid and crystallised intelligence occur seems to be decided more by study design than anything else.
Cross-sectional studies compare young and old people at the same point in time. These seem to show that fluid intelligence declines remarkably early—in one’s early twenties—while crystallised intelligence rises throughout adulthood and peaks somewhere between middle age and one’s sixties. Conversely, longitudinal studies, which test the same people over the course of their lifetimes, are more varied. Some find that both fluid and crystallised intelligence rise through adulthood, with fluid intelligence peaking in one’s fifties or sixties, and crystallised intelligence peaking a couple decades after that still. Others are more closely aligned with the cross-sectional data, hinting at an earlier decline in fluid intelligence.
Aaron Dymarskiy offered a resolution to this apparent contradiction in a Heretical Insights article published last year wherein he highlighted the biases inherent to cross-sectional studies of intelligence and age. Specifically, the Flynn effect, which describes how cognitive test scores are observed to rise with successive cohorts over time, inflates the apparent intelligence of younger people relative to older people. Aaron turned to longitudinal studies for a more faithful representation of the ground truth. In the Aporia version of his article, he concluded that “it is reasonable to conclude that the average 70-year-old is more intelligent than the average 20-year-old”. Here, I will re-examine this conclusion.
Meta-analysing raw longitudinal studies
Longitudinal studies do a fantastic job of removing the impact of the Flynn effect, which is thought to be primarily a cohort effect, because people in the same cohort can be measured across their lives (so cohort is held as constant). While the longitudinal approach removes one bias, it introduces two more in the opposite direction: practice effects and attrition. Retesting the same person many times over the course of their life using the exact same test (which is a necessity) allows them to get better at the test by learning, acclimating, or otherwise improving at the testing process. As you can imagine, this would inflate the IQ scores of the old in longitudinal data. Attrition also biases the IQ scores of the old upwards by selecting for healthier participants (healthier and therefore smarter brains make it all the way through the study). Though I find Aaron’s dismissal of practice effects to be unfounded (as I will explain later), we can initially take this presupposition for granted and see what the raw longitudinal data show.
In Aaron’s piece, he produced a table citing thirteen relevant longitudinal studies. Prima facie, these studies do not support his conclusions. His quoted conclusion (that the average 70-year-old is smarter than the average 20-year-old) is contradicted by Dam & Raven (2008), which reports a decline in Raven’s Advanced Progressive Matrices scores (a test that assesses fluid intelligence above all else) of 0.61 standard deviations (SDs) between ages 20 and 70 (on average). He ignores this result and focuses instead on results from studies where the first test was taken during childhood. Obviously, maturation of the brain confounds the results here. For example, he cites a study by Deary et al. (2004) which compares test scores at age 11 with scores at age 80. The headline result is a rise in scores by 1.08 SDs. However, this result offers no insight into the trajectory of cognitive ability throughout adulthood—it is entirely unsurprising that the immature brain of an 11-year-old is inferior to that of an 80-year-old.
Ignoring these maturation-confounded studies (3 of the 13), I meta-analysed the data from all of the other raw longitudinal studies listed in Aaron’s table. Below, I provide separate trajectories for different subcomponents of intelligence and also a full-scale IQ composite.
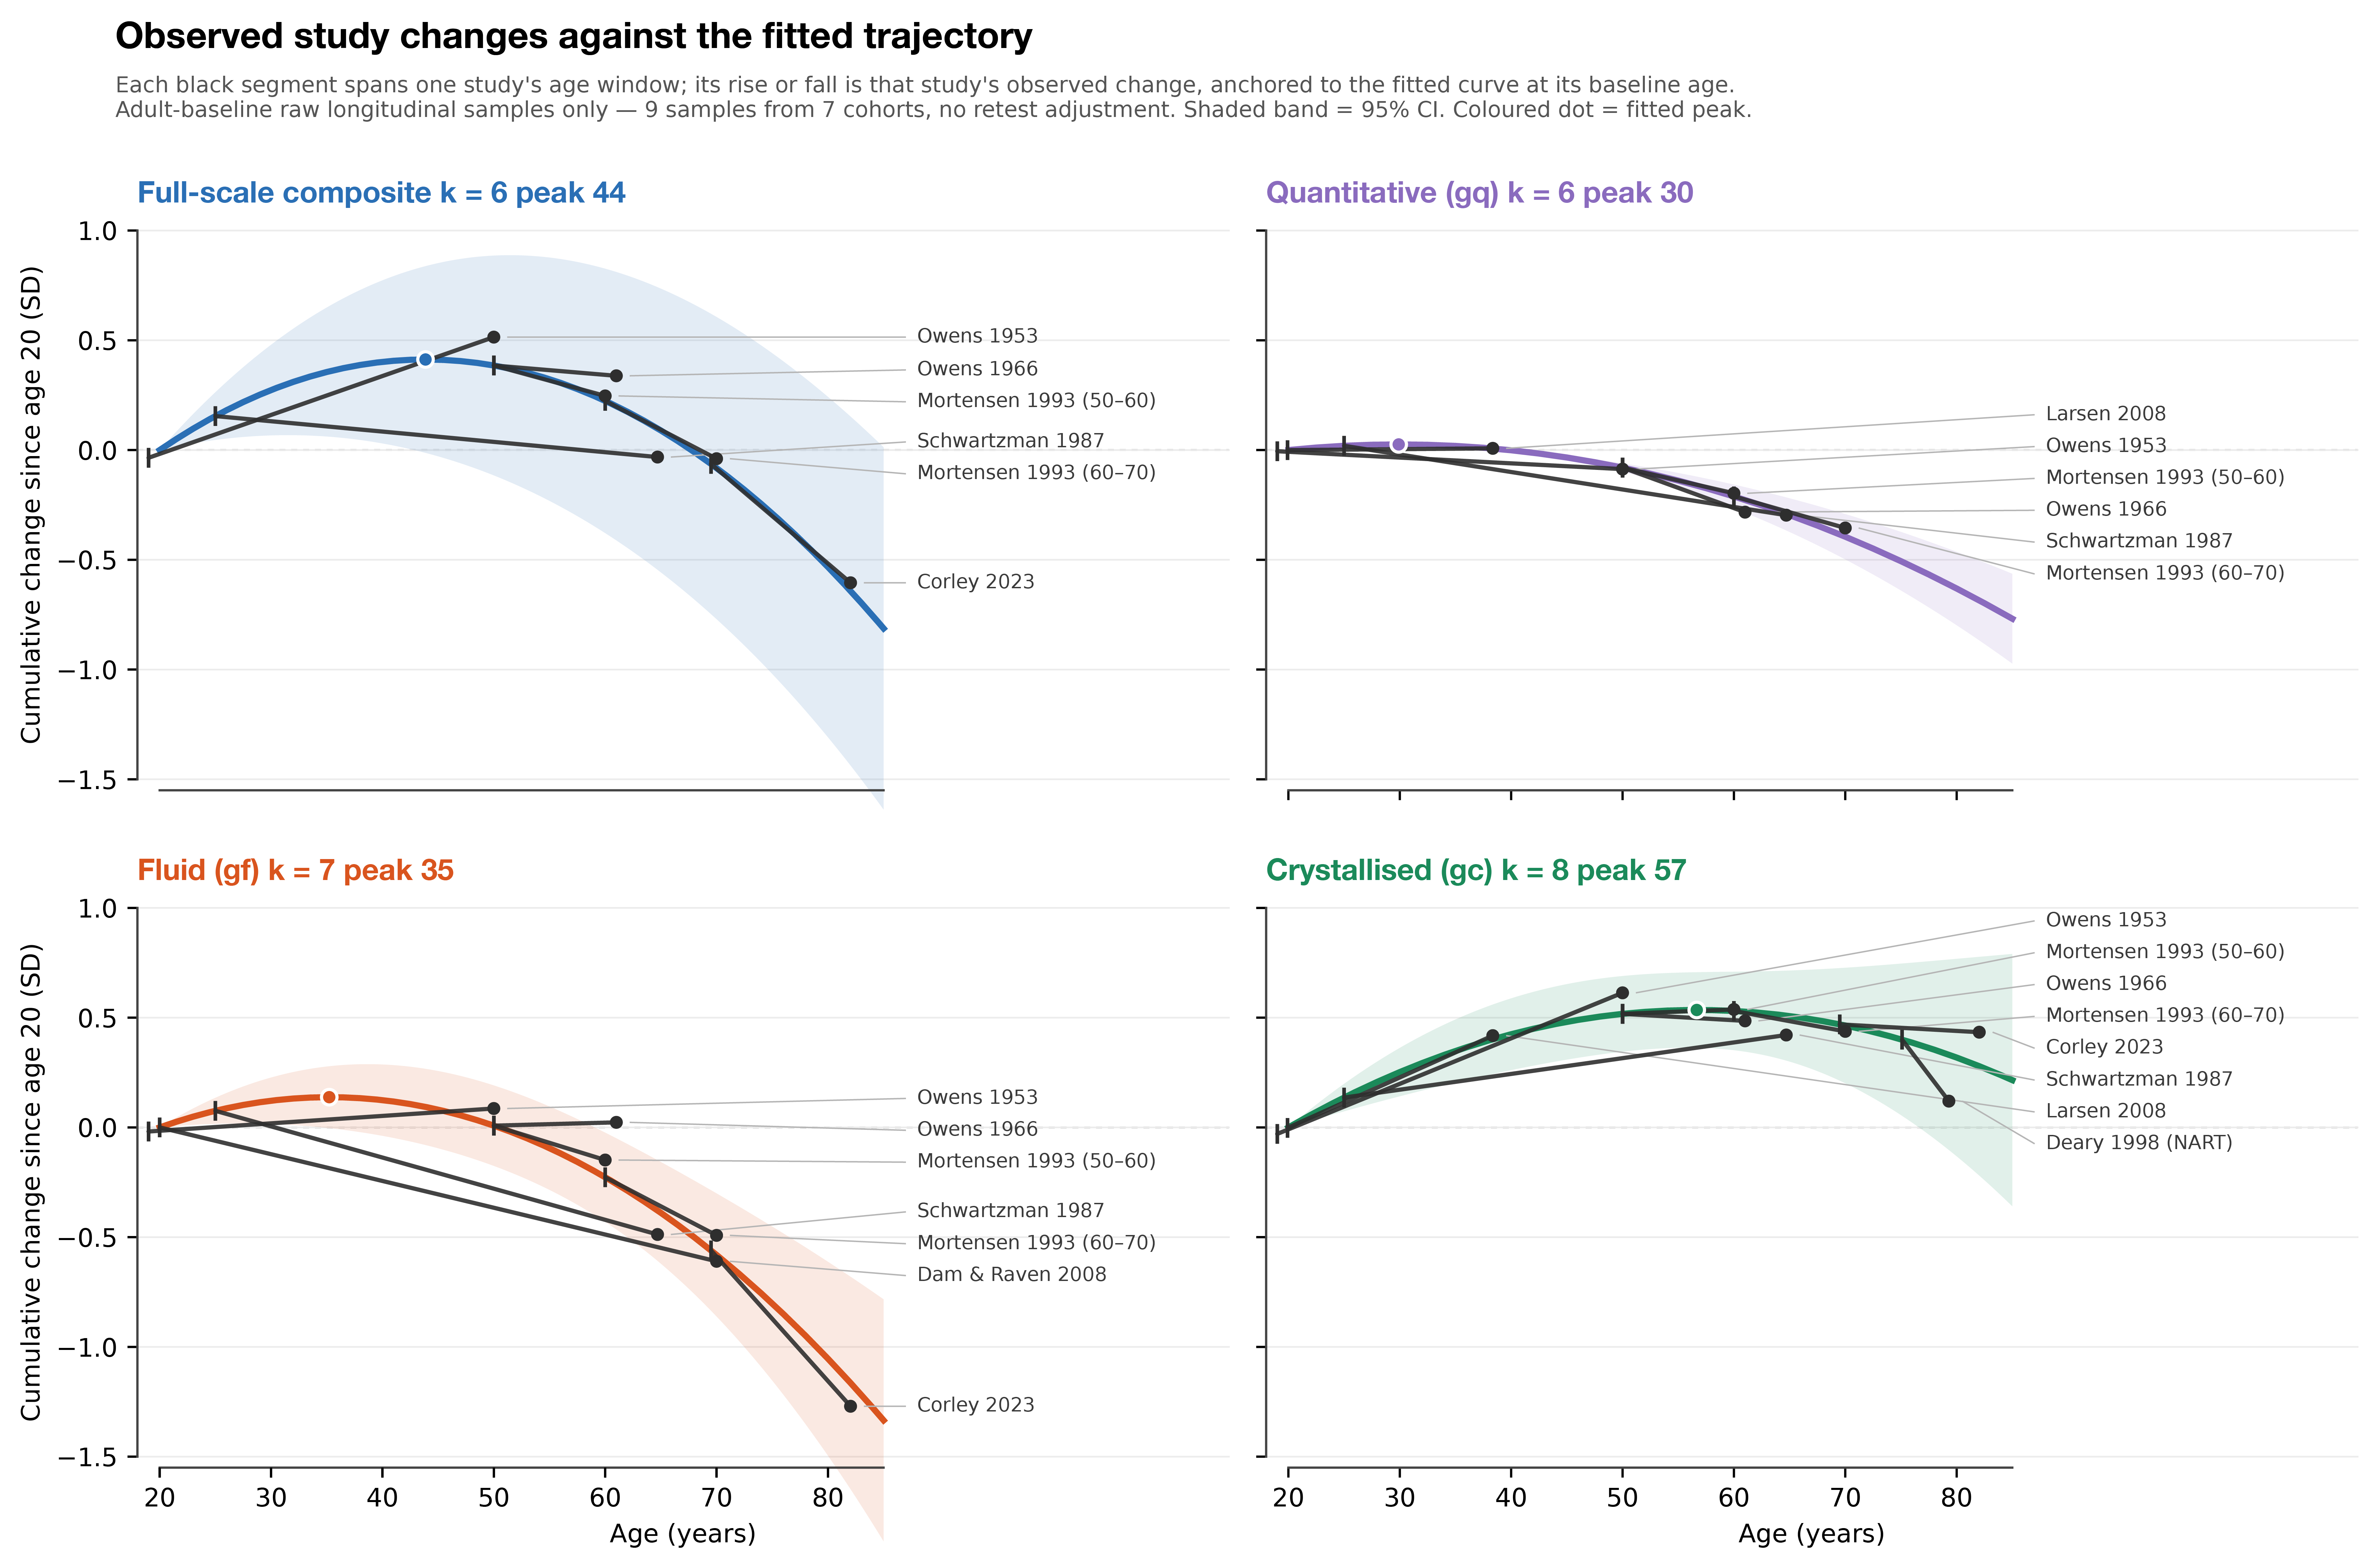
In aggregate, peak full-scale IQ occurs at age 44 here, though the confidence interval for this peak is wide due to low number of studies. For fluid intelligence and quantitative reasoning, the peaks are substantially younger. Thus, even ignoring the pro-old bias of raw longitudinal studies, multiple aspects of intelligence seem to be in decline by middle age.
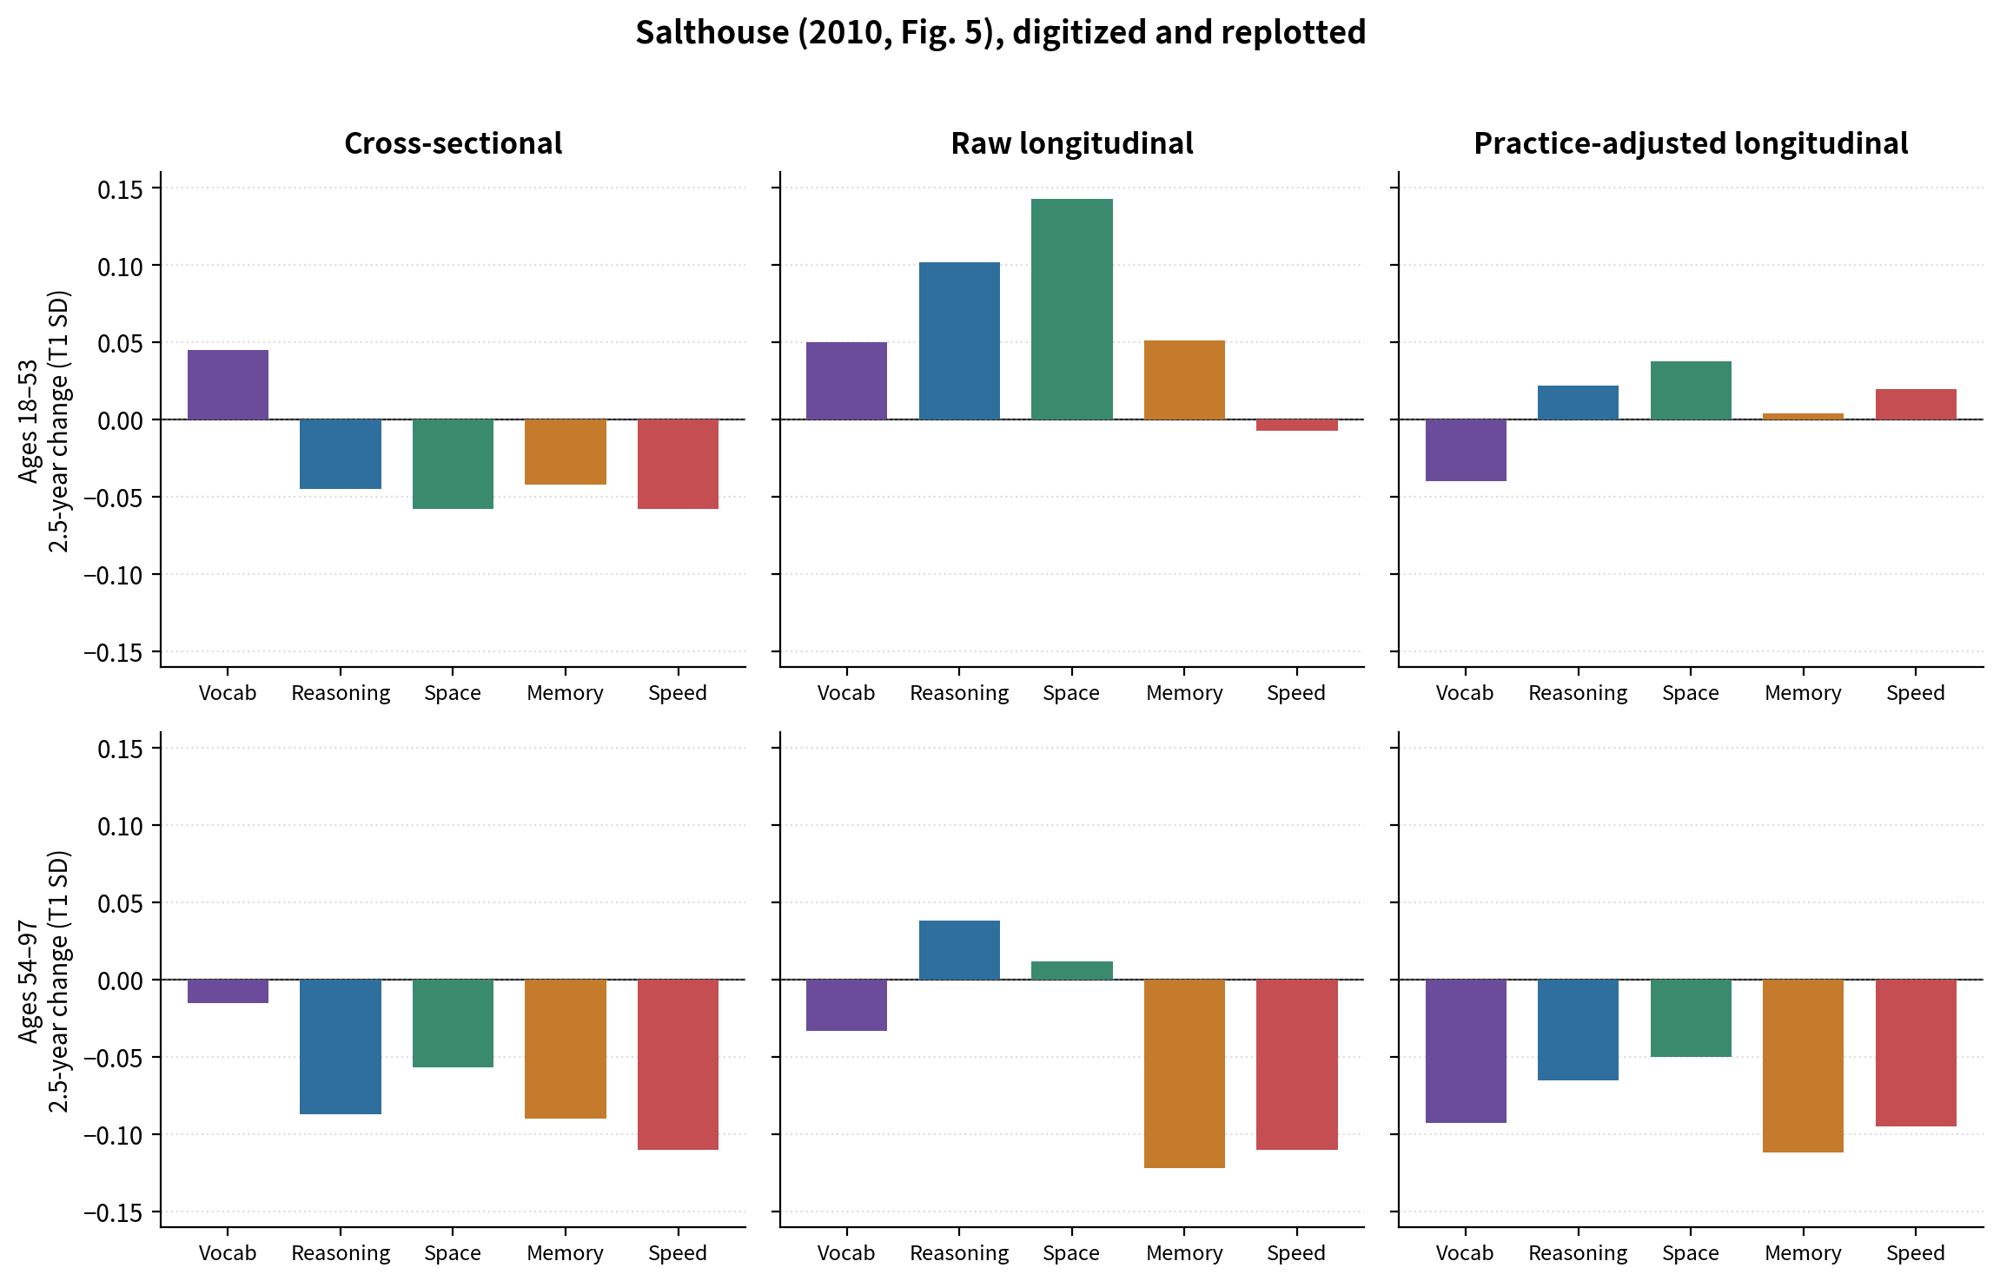
Rather than dwelling on these studies, Aaron then moves on to data from a study by McArdle et al. (2002). Although, instead of looking at their actual data, he instead highlights a reanalysis from a 2010 book by Timothy Salthouse. Salthouse bifurcates the data and reports age-associated changes in cognitive test scores up to age 50 and after age 50. The point of Salthouse’s analysis here is to demonstrate the difference in results between longitudinal and cross-sectional studies, not to gain precise insights into the actual longitudinal trajectories. For the latter purpose, we can simply look at Figure 8 from the original paper by McArdle and colleagues:
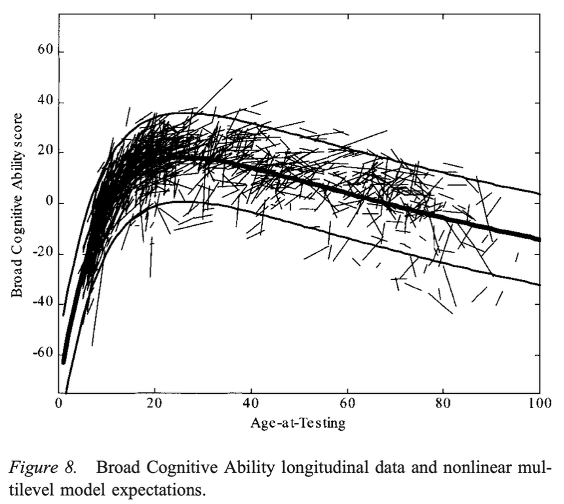
McArdle et al. found that peak intelligence occurs remarkably young! Broad Cognitive Ability (BCA), equivalent to full-scale IQ, peaks at age 26.2, while fluid and crystallised intelligence peak at 22.8 and 35.6 years old respectively. Why are these ages so much younger than what was found in my meta-regression of raw longitudinal data? Well, McArdle and colleagues included a practice effect term in their modelling. And rightly so.
Practice effects can’t be dismissed
Aaron dismisses practice effects for a number of reasons. Before I get into his more nuanced arguments, I’ll address his final one: he claims that practice effects are simply not strong enough to create artefacts in longitudinal data. This is demonstrably not so.
A 2007 meta-analysis of practice effects by Hausknecht and colleagues found that practicing and coaching can have a strong effect on scores. These effects compound with successive testing, but with diminishing returns: their effect size between t1 and t2 was found to be 0.26 standard deviations (SDs) on average, but 0.20 SDs between t2 and t3. Importantly, these effect sizes vary greatly with time between initial test and retest: Hausknecht and colleagues found a significant decline in effect size with increasing test-retest interval. Their combined estimate took data from a very wide range of test-retest intervals (median interval = 20 days; mean = 134.52 days, SD = 304.7 days, minimum = 15 minutes, maximum = 5.18 years), meaning their average effect size may not be that useful.
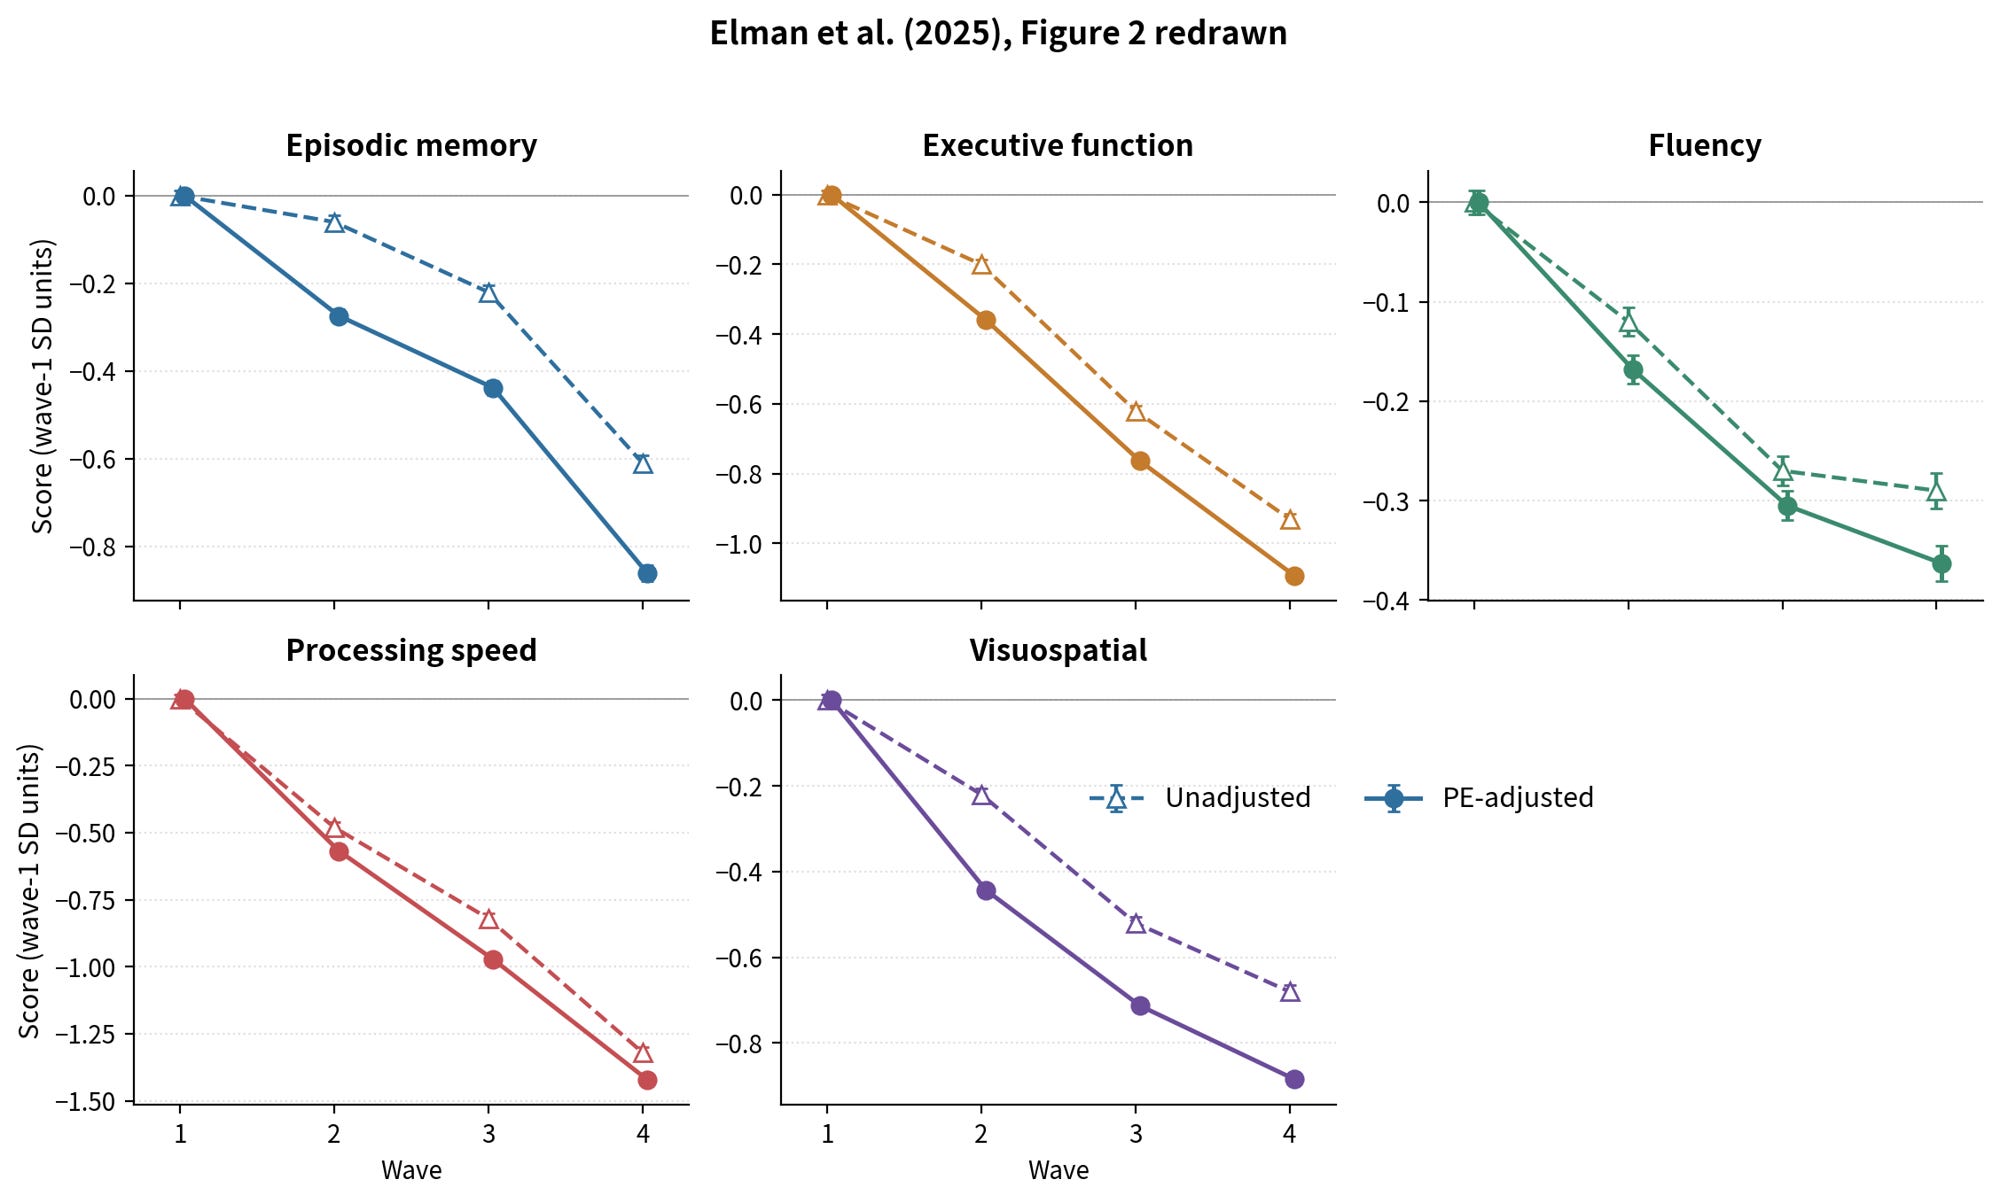
For a more relevant estimate of practice effect magnitude, we can look at a 2025 analysis of the Vietnam Era Twin Study of Aging. This study tested well over 1000 individuals across four waves of tests, each separated by 5-6 years. The authors found that practice effects were in the order of 0.15 to 0.35 SDs at each retest occasion for several tests and, importantly, significantly offset the underlying cognitive decline each time.
How about in McArdle et al. (2002)? How important was it for them to include a practice effect term in their model? Firstly, doing so is defensible regardless of magnitude (if the practice effect is small, then the magnitude of the term will reflect this). Beyond “defensible”, it is the statistically sound thing to do if including the term improves model fit, which McArdle and colleagues found to be the case (Δχ2(2) = 2,070 - 1,838 = 232). As for the magnitude—we can extract it directly. In Table 9 of their paper, they report an average linearised rate of change in BCA scores of -0.3 Rasch W units per year between age 20 and 75. Table 8 gives us the practice effect size for a single retest event, which is +2.7 W. In other words, retesting, on average, bumps up scores by a magnitude equivalent to 9 years of cognitive decline. Since the median test-retest interval for adults was 3.0 years, a typical adult participant would be expected to increase their test scores by 1.80 W despite actually cognitively declining. This is why the raw longitudinal changes presented in Salthouse’s book and referred to by Aaron seem to indicate cognitive improvements—practice effects dwarfed the underlying age-associated changes.
Modelling practice effects when analysing longitudinal data seems to be necessary, so why does Aaron dismiss them? Beyond doubting their magnitude, he cites the following reasons:
An analysis of the Vietnam Experience Study (VES; a study involving longitudinal cognitive testing of US military veterans) found no significant practice effects (Larsen et al., 2008).
An analysis of the Seattle Longitudinal Study (Schaie, 2005) found that some of the practice effects were no longer statistically significant after adjusting for attrition of older participants from the study.
Practice effects should, mathematically, violate the assumption of metric invariance when comparing longitudinal test scores, but Schaie’s analysis of SLS data finds that overall measurement invariance holds in longitudinal data. Ergo, practice effects must be minimal.
I don’t buy the first argument here for two reasons. Firstly, the test-retest interval for the VES was 18 years, so any real practice effects are likely to be very small here. As we have established, the effect size for shorter intervals is meaningful (for example, practice effects significantly mask cognitive decline between tests 6 years apart). Secondly, Larsen and colleagues may not have been measuring 18-year practice effects at all. The authors acknowledge that the 77-78 subjects (from a total of over 4,300) for whom initial test data was absent may have actually taken this test, but the data were lost. Given that it was mandatory for all army recruits to sit the Army Classification Battery upon enrolment, lost archival data is by far the most likely explanation here.
Regarding adjustment for attrition: when considering within-person changes, attrition cannot impact the practice effect. Schaie’s method for decomposing attrition from practice effects is only relevant for quasi-longitudinal studies, where attrition and practice effects can confound each other (quasi-longitudinal studies are an excellent way to study cognitive trajectories, by the way, as I will explain later). Aaron implies that quasi-longitudinal studies do not show there to be a practice effect because Schaie had found these effects to be nonsignificant in many cases. But this conflates statistical significance for effect size. Further, it doesn’t help to make the case for raw longitudinal data stronger—attrition is a bias in its own right, and both attrition and practice effects bias the results of longitudinal studies in favour of older ages. Salthouse has shown that these two biases contribute different amounts at different ages—practice effects are strongest at younger ages and at first retest, while attrition is strongest at older ages (Salthouse 2014). He also used the same method of decomposition as Schaie in another study and found both biases to be substantial (Salthouse 2010). Adjusting longitudinal data for these two biases produces results that are closer to cross-sectional data than raw longitudinal data in many cases.
Aaron’s third point requires two steps: proving that practice effects violate metric invariance theoretically, and showing that measurement invariance is not violated in longitudinal studies.1 The second point is granted—Schaie does confirm measurement invariance in his SLS data. However, this does not preclude practice effects. Aaron aimed to algebraically prove metric non-invariance by inserting a practice effect term into the equation that is used to model test scores (X) as a mishmash of the general intelligence factor (g) multiplied by the g-loading (λ) and a residual (ε):
Rearranging for λ, you get:
When you add in a practice term (which Aaron identifies as pi = -kλi ) to the original equation and rearrange once more for λ, you get:
Now this may look different, and therefore it’s tempting to think, “Oh! Metric non-invariant!”, but it actually shows the opposite. Metric invariance means λi(t) = λi(t+1). The equation for λ with the practice effect incorporated doesn’t violate this. The denominator is now just shifted such that:
This equation just reflects a shift in the latent mean, not the g-loading (i.e., the metric).
Beyond theory, Reeve and Lam put this to the test by testing 123 undergrads three times, each a week apart (Reeve & Lam, 2005). They found the magnitude of practice effects to be enormous (as we might expect): the sentence memory test scores had increased by 1.53 SDs by the second retest! Yet, despite these large practice effects, the authors found not only metric invariance, but complete measurement invariance (i.e., configural, metric, and scalar invariance). The g factors that they could pull out from each set of tests were not significantly different from each other, despite the very different raw scores.2 Thus, the fact that Schaie confirms measurement invariance in his SLS longitudinal data does not speak to the existence or magnitude of practice effects.
The ground truth
While Aaron was right to point out the pro-young bias of cross-sectional studies, he is too quick to dismiss the pro-old bias of longitudinal studies (mediated by both attrition and practice effects). The good news is that we don’t have to guess at the ground truth between these types of data. We have already seen how longitudinal studies can be adjusted for retesting / practice effects. We also have quasi-longitudinal studies, which recruit extra people from the same birth cohort as those who tested at t1, but who themselves are naïve to testing. This physically avoids practice effects. We can also use cross-sectional data, but adjust it for the Flynn effect. All three of these methods are different ways of getting closer to the ground truth. Amazingly, all three are consistent in what they show: these all converge on quite an early decline in all cognitive abilities except for crystallised intelligence, which peaks somewhere between middle age and retirement age.
There is also another cool way to measure cognitive ability that does not suffer from Flynn or retest biases: chronometry. This is the idea of using response time for elementary cognitive tasks (e.g., the time taken to respond correctly when presented with an arrow pointing left or right) as a measurement of general intelligence. Turns out, reaction time (and other derived metrics from such tests) are pretty highly correlated with the general factor of intelligence (up to r = -0.5 in some chronometric batteries). When discussing my disagreements with his earlier article, Aaron brought up chronometric studies as providing a line of evidence that makes him less confident in his earlier assertion that peak IQ occurred later in life. This is because fastest reaction time scores here are typically observed between age 20 and 30.3
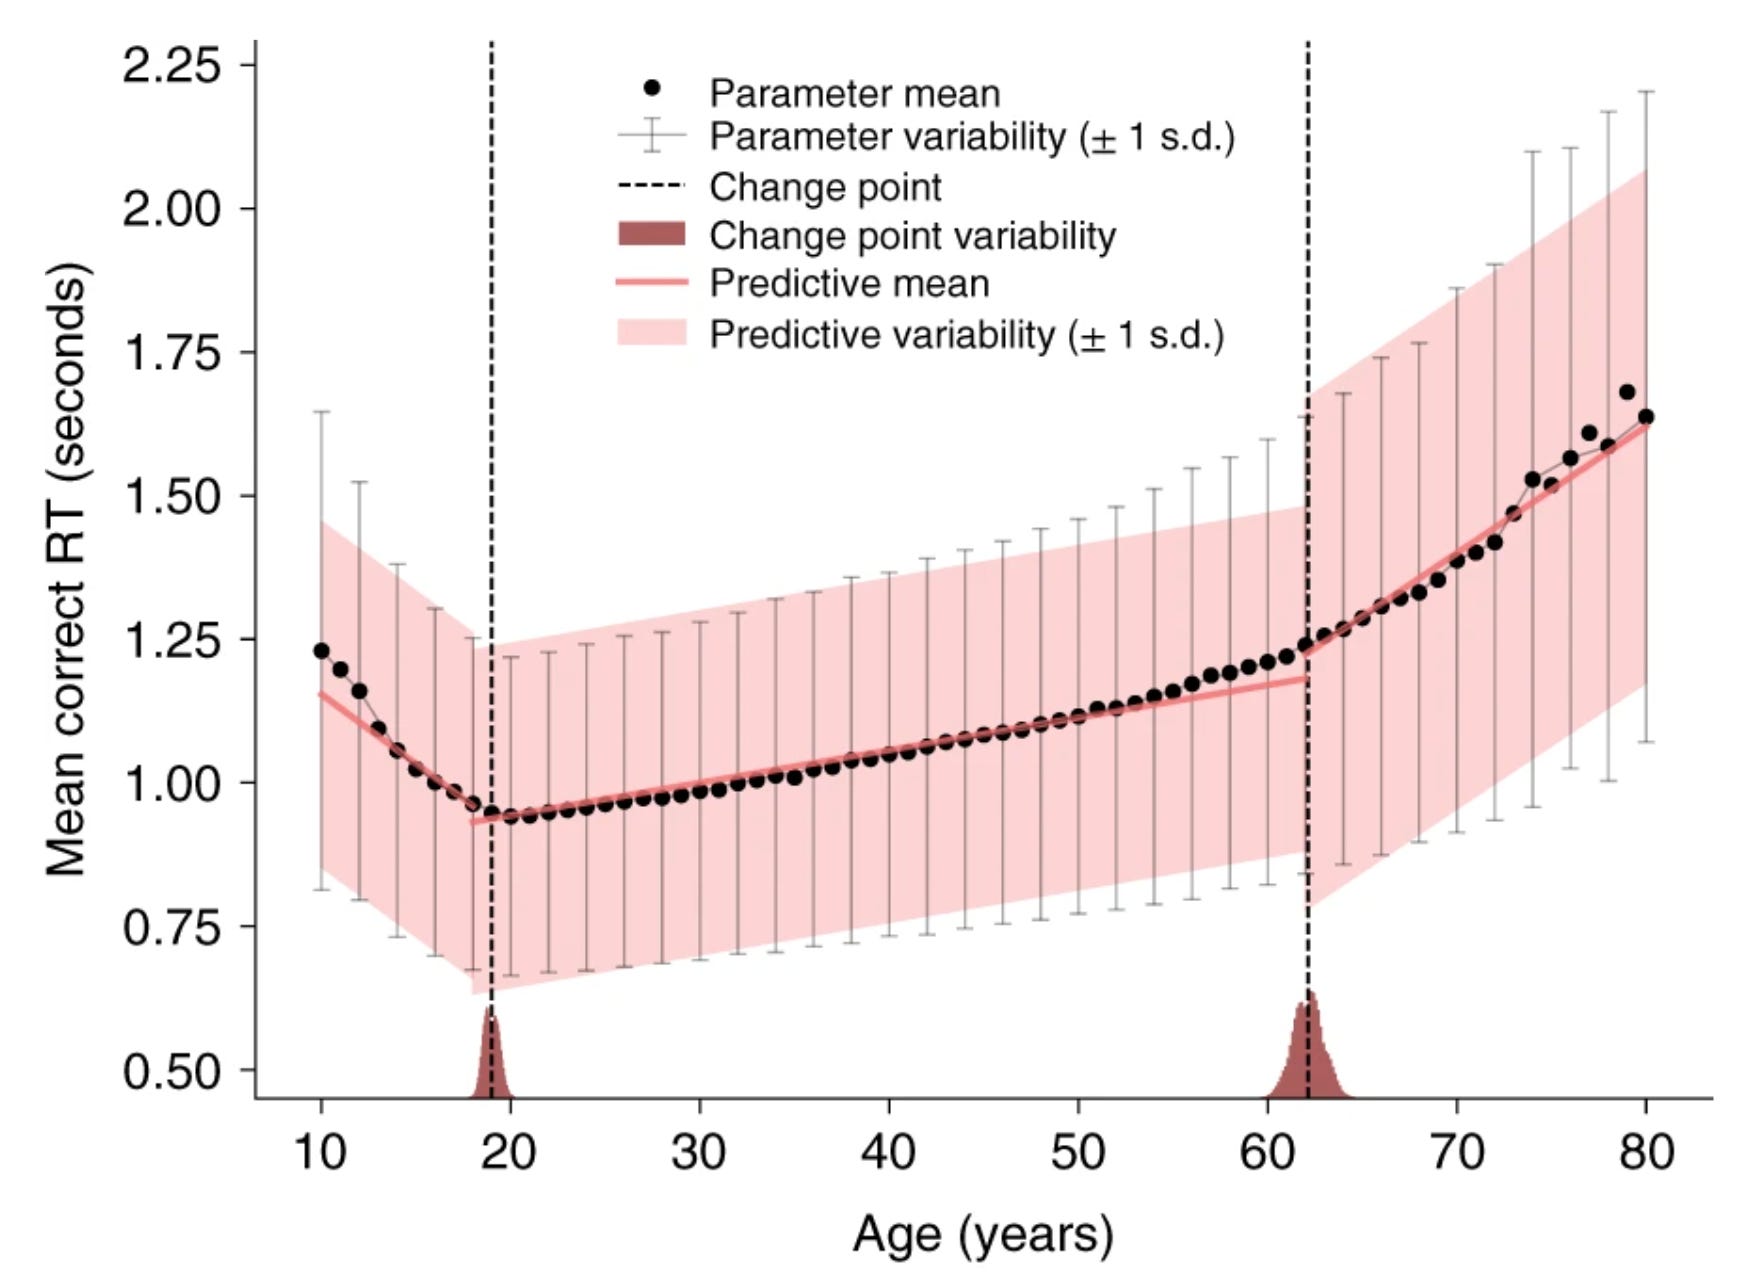
Besides study type, we also see different results in different study settings. Period effects and geographical disparities show slight differences in cognitive trajectories regardless of which method you use to study them. In addition to the quasi-longitudinal analysis of the Seattle Longitudinal Study, one of the best shots at the ground truth comes from Tucker-Drob and colleagues, who adjusted raw longitudinal data for practice effects. Aaron cites their 2022 study to suggest that crystallised and fluid intelligence shouldn’t be considered to have different trajectories.4 In this study, they use huge datasets from the Virginia Cognitive Aging Project (VCAP; a US study) and, separately, the Swedish Betula Project. Their retest-adjusted trajectories can be seen below.
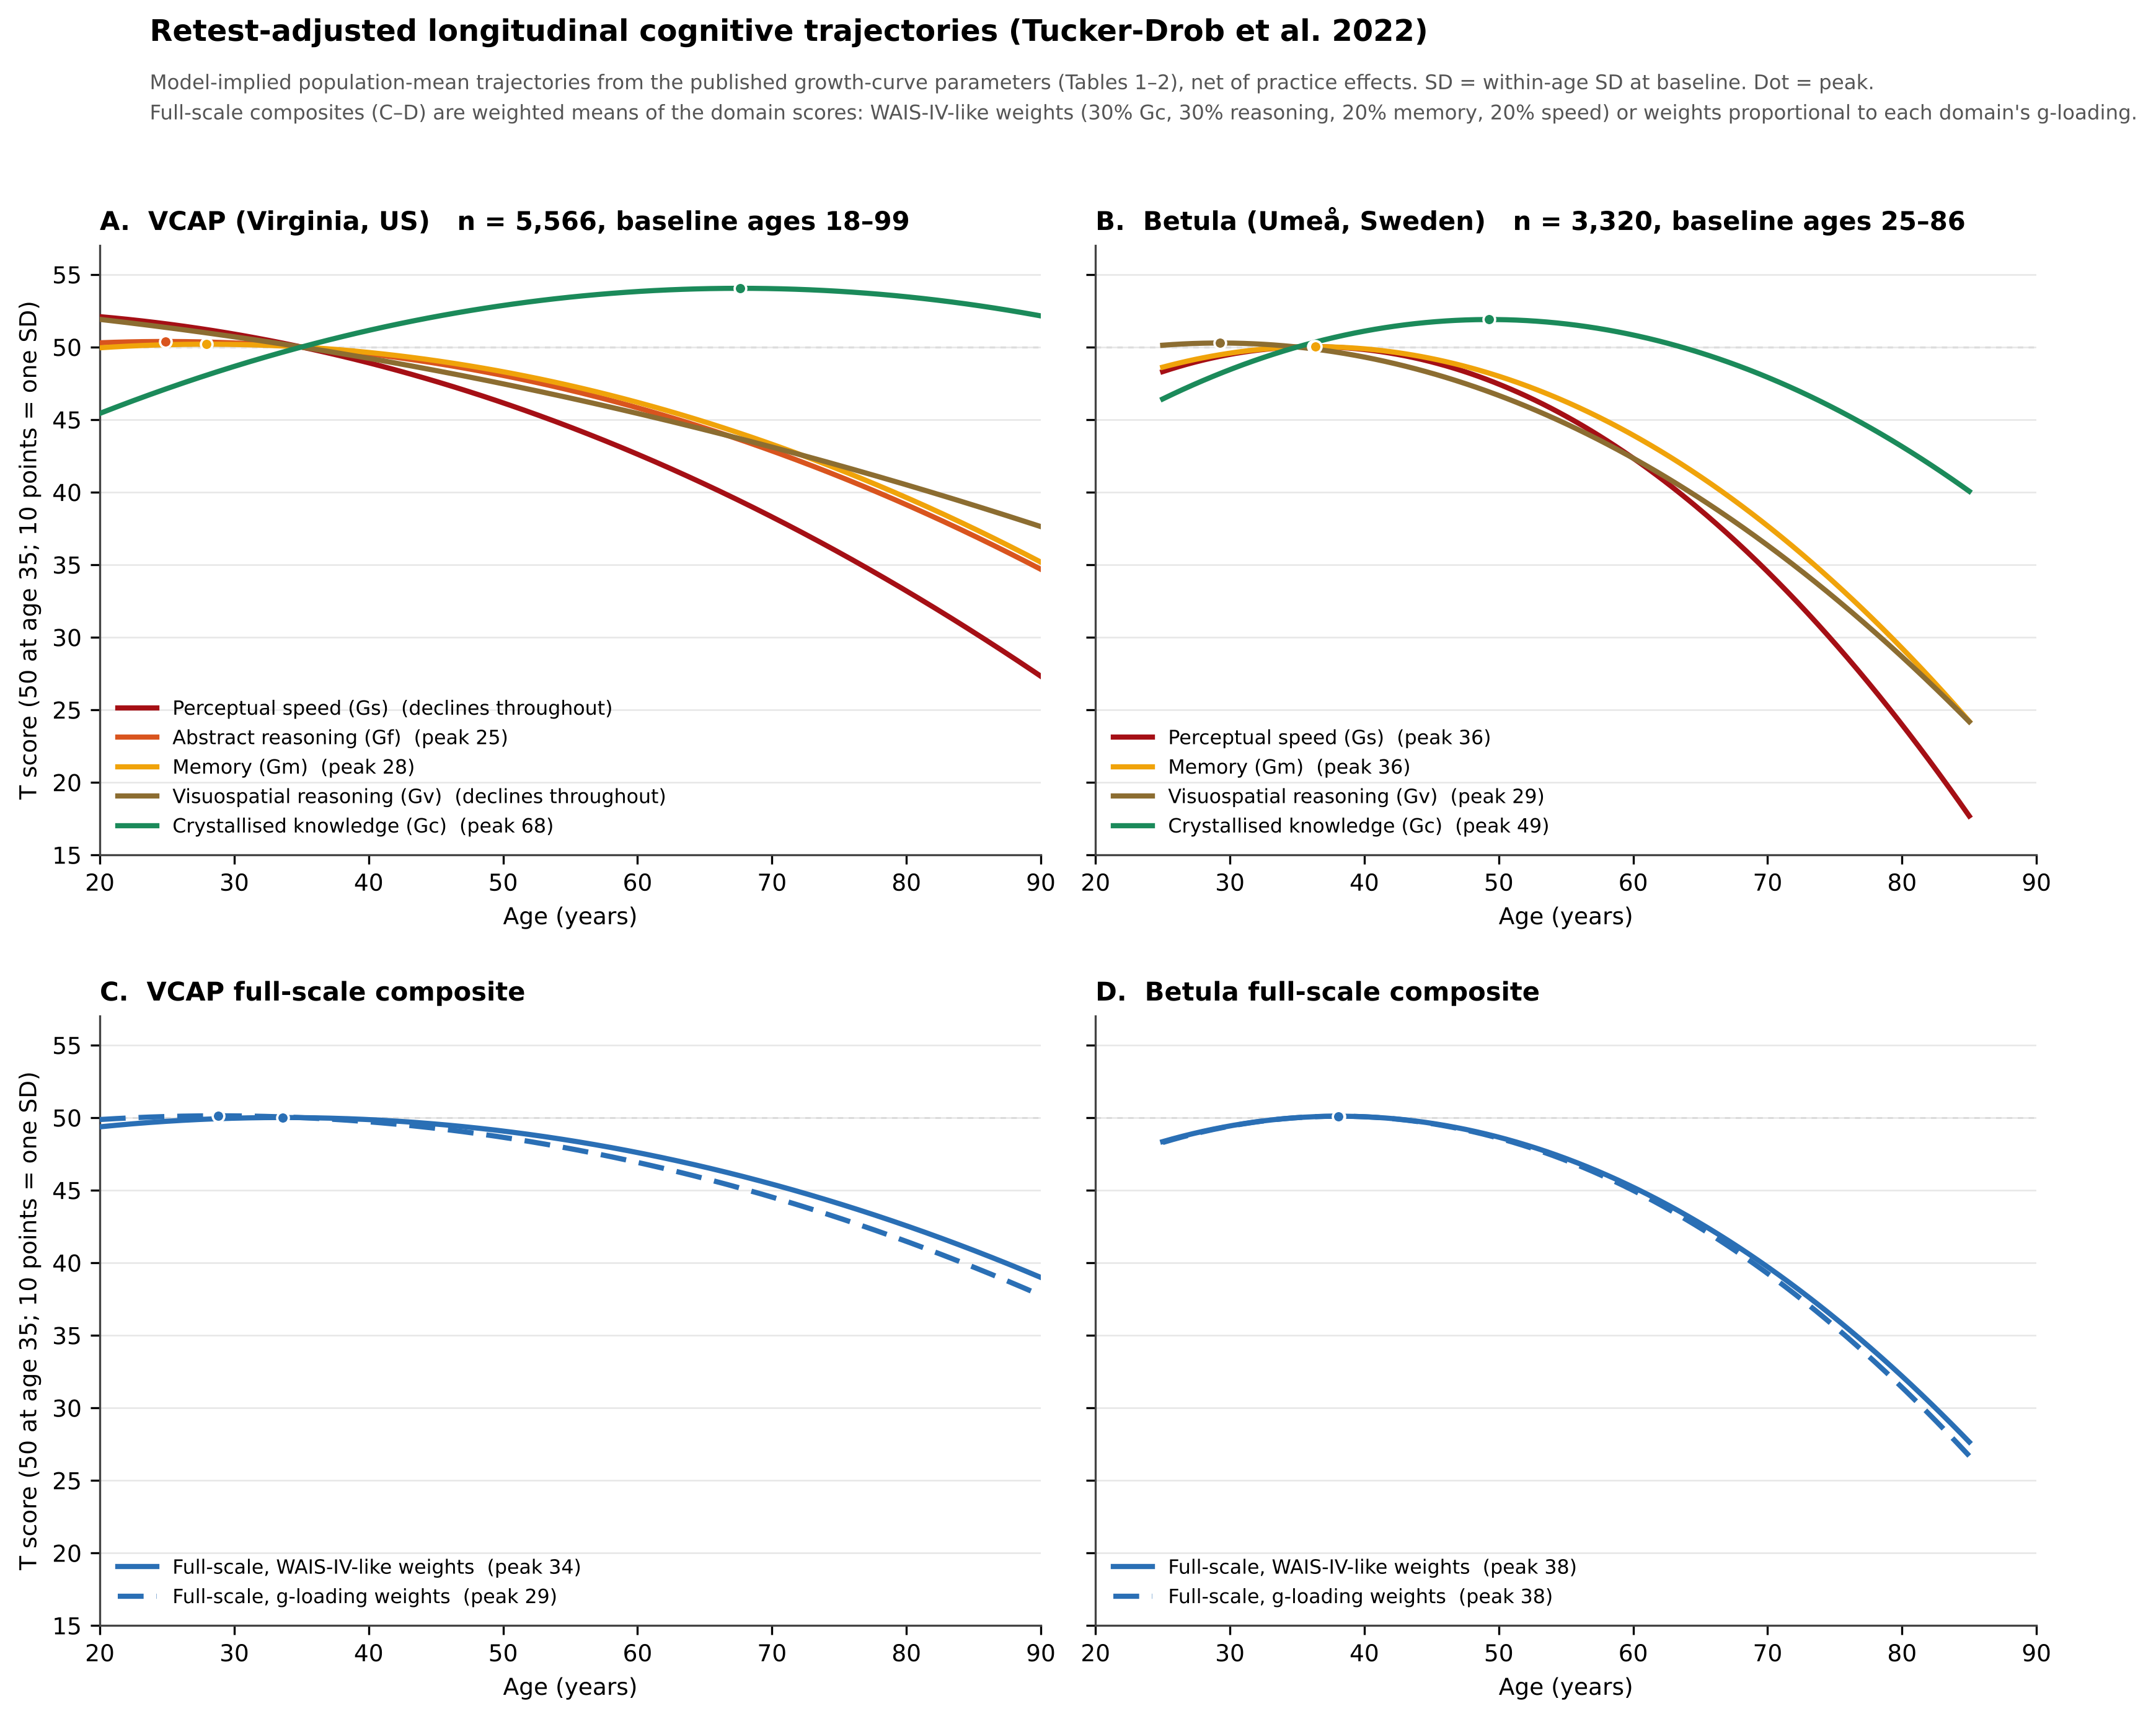
In the US cohort, perceptual speed, abstract reasoning (i.e., fluid intelligence), memory, and visuospatial reasoning all peak in the 20s or earlier. For the Swedish cohort, these peaks are in the late-20s or mid-30s. Only crystallised intelligence peaks later in life—at age 68 for VCAP and 49 for Betula. I have also reconstructed a full-scale IQ estimate from these data.5 In the US study, IQ peaked before age 35, while age 38 was the peak in the Swedish study. Retest-adjusted longitudinal data like these are probably quite reliable estimates of the ground truth.
One final point to make concerns the Flynn effect—the whole reason that we distrust cross-sectional data in the first place. I mentioned that this is considered to be a cohort effect, but Salthouse (2014) argues that it could also be a period effect. If this is the case, then the Flynn effect actually biases longitudinal data in a pro-old direction and leaves cross-sectional data unaffected! I am not aware of any studies of longitudinal data that have attempted to adjust for period-Flynn, practice effects, and attrition on the same cognitive trajectories.
I imagine most readers are looking at the above plots and feeling quite depressed. An important thing to bear in mind here is that these are historical datasets and they are population averages. There are a number of lifestyle interventions that one can deploy to stave off cognitive decline (exercising and avoiding alcohol are two obvious ones), and starting as young as possible seems advisable if you care about the trajectory of your cognitive abilities. Indeed, we are already seeing evidence that old people today experience less cognitive decline than old people of yesteryear. We don’t need to live in fear of losing IQ points, but we shouldn’t live in denial either.
All data, code, and methods needed to reproduce the analyses done here can be found here.
Metric invariance is one component of measurement invariance. Something called “Multi-Group Confirmatory Factor Analysis” is used to examine measurement invariance, and it breaks it down into configural invariance, metric invariance, scalar invariance, and strict invariance. The only important takeaway here is the following: if metric invariance is proven, it does not necessarily mean that overall measurement invariance holds. However, if overall measurement invariance is proven, then metric invariance is necessarily true.
In the above algebra, we concluded that the latent g would shift from practice effects, but Reeve and Lam found that, in reality, it doesn’t. Aaron’s simplification of the practice term as pi = -kλi is not quite right. We’re getting into the weeds a bit here, but the full model for practice effects is pi = α - kλi + ui , where α is a general gain seen in all retests (e.g., from having less test anxiety) and ui is a unique bump for a specific retest (e.g., remembering specific words in a vocab test). Aaron got rid of those other terms after citing te Nijenhuis et al. (2007)—a meta-analysis that found that the vector of mean subtest gains correlated r̄ = -0.80 with the vector of g-loadings. After artefact adjustment, this correlation was -0.95 (which they interpret as -1). This doesn’t mean that α disappears from the expression. And since the observed correlation is -0.80 (not -1), it also means ui shouldn’t be eliminated from the expression either. Without the intercept term α, Aaron’s expression for practice effects implies that they cause scores to decrease, which is obviously not right. Using this full expression predicts scalar non-invariance, not metric non-invariance. But Reeve and Lam show that scalar invariance holds empirically anyways for somewhat paradoxical reasons.
One caveat here is that chronometry is more strongly correlated with fluid intelligence than other subdomains of intelligence or full-scale IQ.
I think this is a slight mis-citation: their study finds that the rate of change between the gf and gc is correlated, not that the trajectories themselves are similar. However, this finding is quite cool. For any old people reading: it means that if you are still good at retaining and deploying facts (i.e., high crystallised intelligence), your fluid intelligence probably hasn’t declined by much either.
The peak age for full-scale IQ depends on how you weight each subcomponent. Two defensible ways to do this are weighting by the g-loading of each subcomponent and weighting in a way that mimics the Wechsler Adult Intelligence Scale (Fourth Edition) weightings (30% Gc, 30% reasoning, 20% memory, 20% speed). For each of these respective weighting methods, peak IQ occurs at age 29 or 34 in the VCAP dataset and age 38 (for both methods) in the Betula dataset.