
How much protein should you eat?
A comprehensive review of meta-analyses

The following is an in-depth literature review. Not a usual occurrence, but published as part of a Substack pilot to index academic articles here. It may at some later stage be peer-reviewed elsewhere. Hopefully you find it informative! - Adam
Abstract
The recommended daily allowance for protein is 0.8 grams per kilogram of bodyweight per day, or around 50 g per day for the average person. Eating more than the RDA is beneficial for controlling hunger, building muscle mass, and gaining strength—all of which benefit health and healthspan. Yet there is some scepticism towards the notion that “more is better”, with some advocating that excessively high protein intakes, beyond 1.6 g/kg/d for example, yield no further benefit or may be actively harmful. This review synthesises the benefits and risks of a high protein diet. The wealth of observational data in humans comes out in favour of “more is better” except for those with pre-existing chronic kidney disease. To determine the optimal protein intake for maximising accretion of muscle mass—which is predictive of healthspan—seven relevant meta-analyses of randomised controlled trials (RCTs) are dissected in detail. Higher daily protein intakes are beneficial for lean body mass at all ranges of intake. With concomitant resistance training, this dose-response relationship is remarkably linear. Therefore, personalised protein intake recommendations in healthy resistance-training individuals should maximise protein intake within financial and practical constraints, but unconstrained by perceptions of health concerns or diminishing returns.
Introduction
Protein is the only nitrogen-containing macronutrient, and is essential for human survival. Globally, over 180,000 people die per year from protein deficiency—with the vast majority being infants and the elderly (fortunately, this figure is now almost four times smaller than what it was in 1980) [1].
The US Institute of Medicine, based on a 2003 meta-analysis of nitrogen balance studies [2], recommends adults consume 0.8 grams of protein per kilogram of bodyweight per day, or 50 g for the average person eating a 2000 kcal diet. However, this number represents the minimum intake to stave off protein deficiency and muscle wasting, not the optimal amount for human flourishing. The Acceptable Macronutrient Distribution Range (AMDR), on the other hand, offers a recommended range of protein intake as part of an optimal diet [3]. This range is 10-35% of calories, which translates to between 0.8 and 2.8 g/kg/d of protein—the upper limit of which is substantially higher than the Recommended Dietary Allowance (RDA).
Within this large range, it is likely that precise optima vary across different populations. To offer more precise guidance for the elderly, an international panel of experts was brought together by the European Union Geriatric Medicine Society in 2013. The resulting PROT-AGE study group reached the conclusion that, for optimal health, adults over 65 years old should consume 1.0-1.2 g/kg/d of protein as a minimum if they are sedentary [4]. However, they also recommended that such adults not be sedentary—prescribing endurance- and resistance-based exercise at an individually tolerable level—and that the inclusion of such exercise increases the protein recommendation above 1.2 g/kg/d. They also noted that most older adults with acute or chronic diseases, with the exception of untreated severe kidney disease, need an even higher protein intake to optimize health, of around 1.2-1.5 g/kg/d.
Despite this, the notion that increasing protein intake above the 0.8 g/kg/d IoM RDA might be beneficial is still rebuked by academics and journalists alike. In a 2019 perspective, Mittendorfer and colleagues concluded that consuming more than 0.8 g/kg/d is not beneficial for muscle mass outside of weight loss and is not beneficial for overall physical function [5]. More recently, the New York Times argued the same, insisting that 0.8 g/kg/d is “adequate for most people’s basic needs”.
Beyond basic needs, the International Society of Sports Nutrition recommends healthy and exercising individuals consume 1.4-2.0 g/kg/d of protein, with resistance trained individuals requiring intakes at the upper end of this spectrum [6]. A combination of endurance and resistance exercise are already uncontroversially recommended for optimal human health, the benefits of which include increased quality of life and reduced all-cause mortality [7,8]. Therefore, the optimal protein intake must assume endurance and resistance training as a given if we are truly optimizing human health.
Yet even among exercising populations, optimal protein recommendations are disputed. For example, science communicators and journalists have recently argued against protein intakes beyond 1.6 g/kg/d, claiming no benefit beyond this intake and even suggesting that such high intakes may be actively harmful [9,10]. This review will summarise and critique the mechanistic data that have led to such assertions of harm, and look at the broader observational signals in human populations.
Beyond observational data, this review will focus not on preventing deficiencies or recommendations for sedentary individuals, but on the optimal daily protein intake for individuals following other healthspan-optimising recommendations. To this end, meta-analyses of randomised control trials (RCTs) focused on the impact of higher protein intake in combination with exercise will be discussed. Inclusion criteria of large meta-analyses, subgroup analyses, and meta-regression adjustments for covariates will be carefully dissected. For example, RCTs with resistance training versus without resistance training; RCTs in younger versus older populations; RCTs in obese versus healthy individuals; and RCTs of untrained versus trained individuals will be differentiated. The resulting synthesis will converge on a recommended daily protein intake for healthy exercising individuals looking to optimise healthspan.
The importance of muscle mass and strength for healthspan
The primary benefit of a higher protein intake is enhanced accretion of muscle mass and increased strength. While historically a niche outcome to optimise for, enhanced muscle strength and size are increasingly at the forefront of efforts to improve human health and healthspan. For example, muscle mass strongly predicts longevity in older adults, with top quartile for muscle mass having 20% lower risk of all-cause mortality than bottom quartile [11]. Further, a 2020 meta-analysis of observational studies found that sarcopenia—defined as the progressive loss of muscle mass and function—was correlated with a wide range of negative health outcomes, from cognitive impairment and depression to metabolic diseases, hospitalization, and all-cause mortality [12].
In addition to muscle mass, muscle strength as measured by grip strength is also significantly negatively correlated with all-cause mortality risk and cause-specific mortality risk from cancer, cardiovascular disease, and respiratory disease according to a UK Biobank prospective cohort study of over half a million participants [13]. Recent Mendelian randomisation studies have also linked grip strength with adiposity and shown that higher grip strength is causally upstream of increased cardiorespiratory fitness [14,15].
Given the strong correlational and causative evidence that resistance training enhances quality of life and reduces mortality risk [16,17], the potential for optimised protein intake to maximise resistance training-induced benefits on muscle mass and strength, and thereby health and healthspan, is of great importance for public health. Meta-analyses of RCTs specifically focused on this question will be discussed later.
Risks of high protein intake
Arguments against excessive protein intake also deserve consideration. Mechanistically, in vitro and mouse studies suggest that excessive protein intake may drive atherosclerosis by activating mammalian/mechanistic target of rapamycin (mTOR) in macrophages [18,19]. Of course, mTOR activation is also the mechanism by which protein and resistance training drives muscle protein synthesis, which we know to be beneficial [20,21].
In humans, the story is more complex. Mittendorfer and colleagues have argued that a high protein diet without concomitant carbohydrate restriction may present a risk for metabolic disease [5,22]. This is based on the fact that protein ingestion elevates blood insulin and glucagon levels, which, when chronically elevated, are risk factors for type 2 diabetes. However, this assertion ignores the fact that protein-induced elevations in insulin and glucagon are acute and simultaneous, and so do not elevate overall blood glucose concentration either acutely or chronically [23].
High protein diets have also been proposed to place the kidneys under increased strain. Indeed, in adults who already have chronic kidney disease, restricting protein intake was shown to decrease the risk of kidney failure and end-stage renal disease, but not all-cause death events according to a 2018 meta-analysis of RCTs [24]. However, in healthy adults—the focus of this review—RCTs have shown no alteration of kidney function from high vs normal vs low protein diets [25]. Further, a recent meta-analysis of observational studies found an inverse correlation between protein intake and risk of developing chronic kidney disease [26].
Observational studies on protein intake and lifespan or healthspan
To gain more relevant insight into the relationship between protein intake and lifespan, there is a wealth of observational studies. At first glance, the results here seem mixed. One meta-analysis of eleven prospective cohort studies with 350,452 participants found that higher protein intake was associated with increased all-cause mortality, although removing animal protein from the analysis reversed the direction of the association [27]. Yet, a larger meta-analysis of 32 prospective cohort studies with 715,128 participants found a negative correlation between all-cause mortality and higher protein intake across total, animal, and plant protein [28].
It is plausible that certain animal-specific lipids confound these studies in favour of lower (animal) protein intakes, given that a network meta-analysis of prospective cohort studies found that replacing saturated fatty acids (SFA) with ω-3 or ω-6 poly-unsaturated (PUFA) and mono-unsaturated fatty acids (MUFA) was associated with decreased all-cause mortality [29]. Supporting the notion that the correlation between high protein diets and reduced all-cause mortality is confounded by SFAs is The Kawasaki Aging and Wellbeing Project, in which fish (low in SFA, high in PUFA) represented the predominant protein source, which found that the individuals in the top quartile of protein intake had less than half the risk of all-cause mortality than those in the lowest quartile [30].
Degree of food processing is another plausible confounder that can explain why some observational studies find a positive correlation between animal protein intake and all-cause mortality. Prior to commercial expansion, vegan or plant-based diets have historically required an emphasis on whole foods over ultra-processed foods, while many animal-protein-containing foods are highly processed. Ultra-processed foods have been recently shown, in a RCT which equated calories, protein, and fibre between groups, to drive increased fat mass retention relative to a minimally processed diet in the context of caloric restriction [31]. Further, large prospective cohort studies have shown negative outcomes for cardiovascular disease risk, cancer risk, and all-cause mortality risk from processed meat but not unprocessed meat [32,33].
Thus, it is likely that the seeming advantage of plant protein in many large prospective cohort trials is mediated by lower ultra-processed foods, lower SFAs, and higher fibre intakes, the latter also being strongly correlated with reduced all-cause mortality [34]. When compared head-to-head in RCTs, multiple meta-analyses show that isolated animal protein supplementation is superior for muscle mass and strength compared to isolated plant protein supplementation [35,36].
It is worth noting that most prospective cohort studies investigating protein intake and longevity focus on older adults to be able to follow them until death. To address the dearth of insight for younger populations, and to focus on quality of life rather than mortality risk, a 2024 prospective cohort study studied the relationship between midlife protein intake and healthy aging, defined as “being free from 11 major chronic diseases, having good mental health, and not having impairments in either cognitive or physical function” [37]. The authors found a significant correlation between total, animal, dairy, or plant protein intake and healthy aging among 48,762 nurses under 60 years old.
Taken together, prospective cohort studies provide clear support for the notion that high protein diets improve disease and mortality risk, with the caveat that SFAs or ultra-processed foods or low fibre diets may blunt or reverse these benefits at the population level. Speculative mechanisms by which a high protein diet may negatively impact human health, such as macrophage mTOR activation, are therefore seemingly outweighed by the larger positive impacts of a high protein diet. Further, healthy kidney function is unaffected by high protein intakes, although individuals with pre-existing chronic kidney disease might be able to slow their disease progression by restricting protein intake, although their mortality risk is not increased by a higher protein intake. The preponderance of observational data supports the recommendation of a high protein diet for health, healthspan, and longevity, although precise quantitative recommendations are difficult to extract from these studies.
Optimising protein intake for muscle mass and strength
The beneficial effects of a high protein intake on healthspan and lifespan are mediated by improved body composition, enhanced muscle mass, and enhanced muscle function/strength. Meta-analyses of RCTs consistently show that higher protein intakes boost satiety and this can aid fat loss in both healthy and overweight individuals [38,39]. Meta-analyses of RCTs also consistently show that higher protein intakes support muscle mass accretion, strength gains, and the prevention of muscle atrophy during caloric restriction for healthy, overweight, or aged populations—especially in combination with resistance training [40–45]. A single exception here is a 2018 meta-analysis of RCTs by ten Haaff and colleagues which focused on the effects of protein supplementation on muscle size and function in non-frail community-dwelling elderly individuals [46].
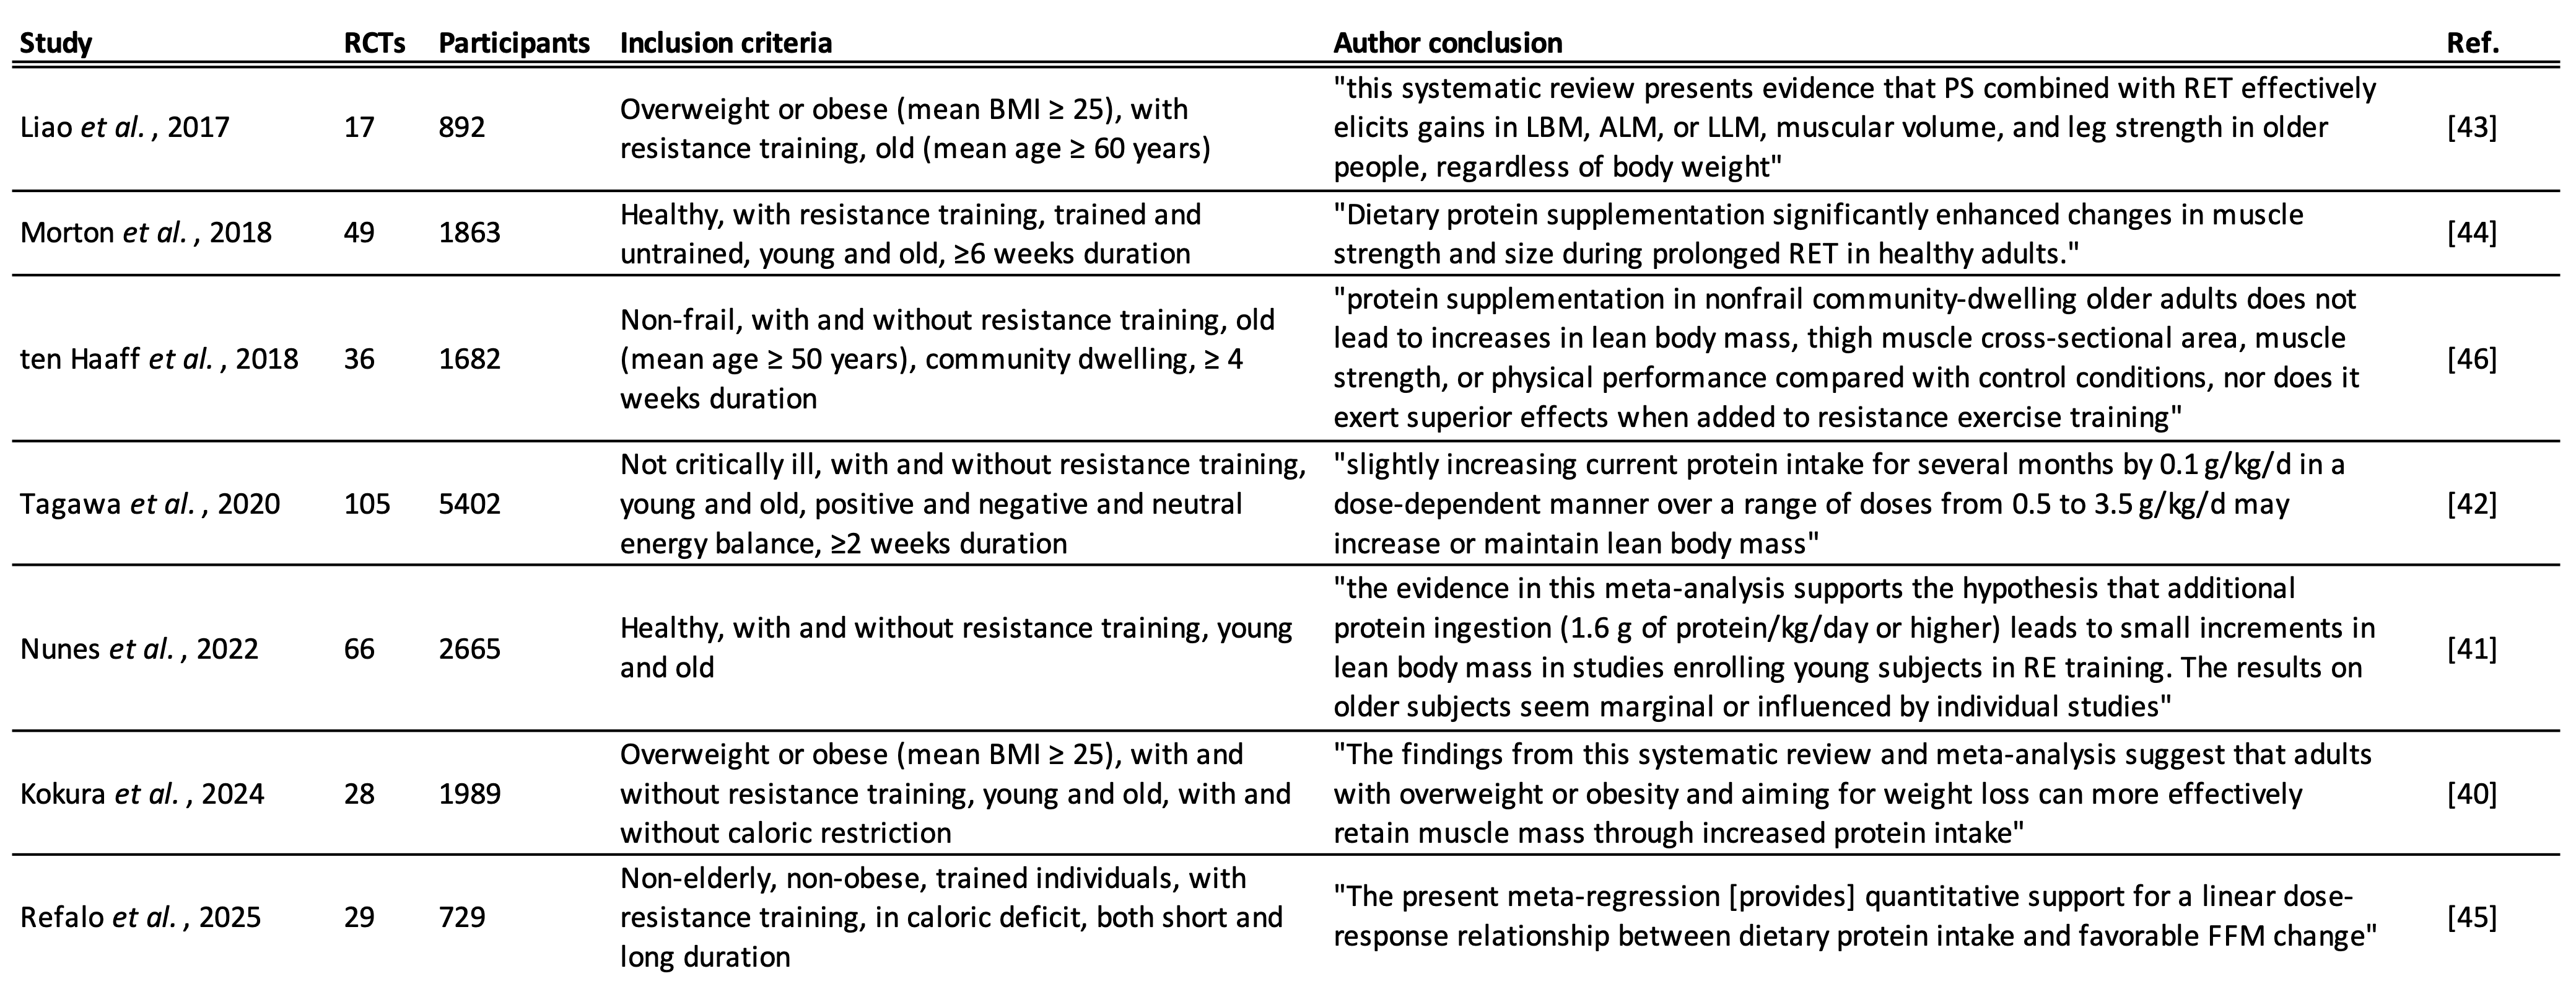
To explain this outlier, and to extract precise protein intake recommendations from all of these meta-analyses, the remainder of this review will focus on seven relevant meta-analyses, shown in Table 1, performing re-analysis where appropriate.
Liao et al., 2017
Liao and colleagues performed a meta-analysis of 17 RCTs entitled: “Effects of protein supplementation combined with resistance exercise on body composition and physical function in older adults” [43]. The subjects of the RCTs were elderly and overweight, averaging 73.4 ± 8.4 years old and with a BMI of 29.7 ± 5.5. The RCTs all included resistance training. Higher protein intakes combined with resistance training resulted in significantly greater gains in lean mass and strength compared to just resistance training alone.
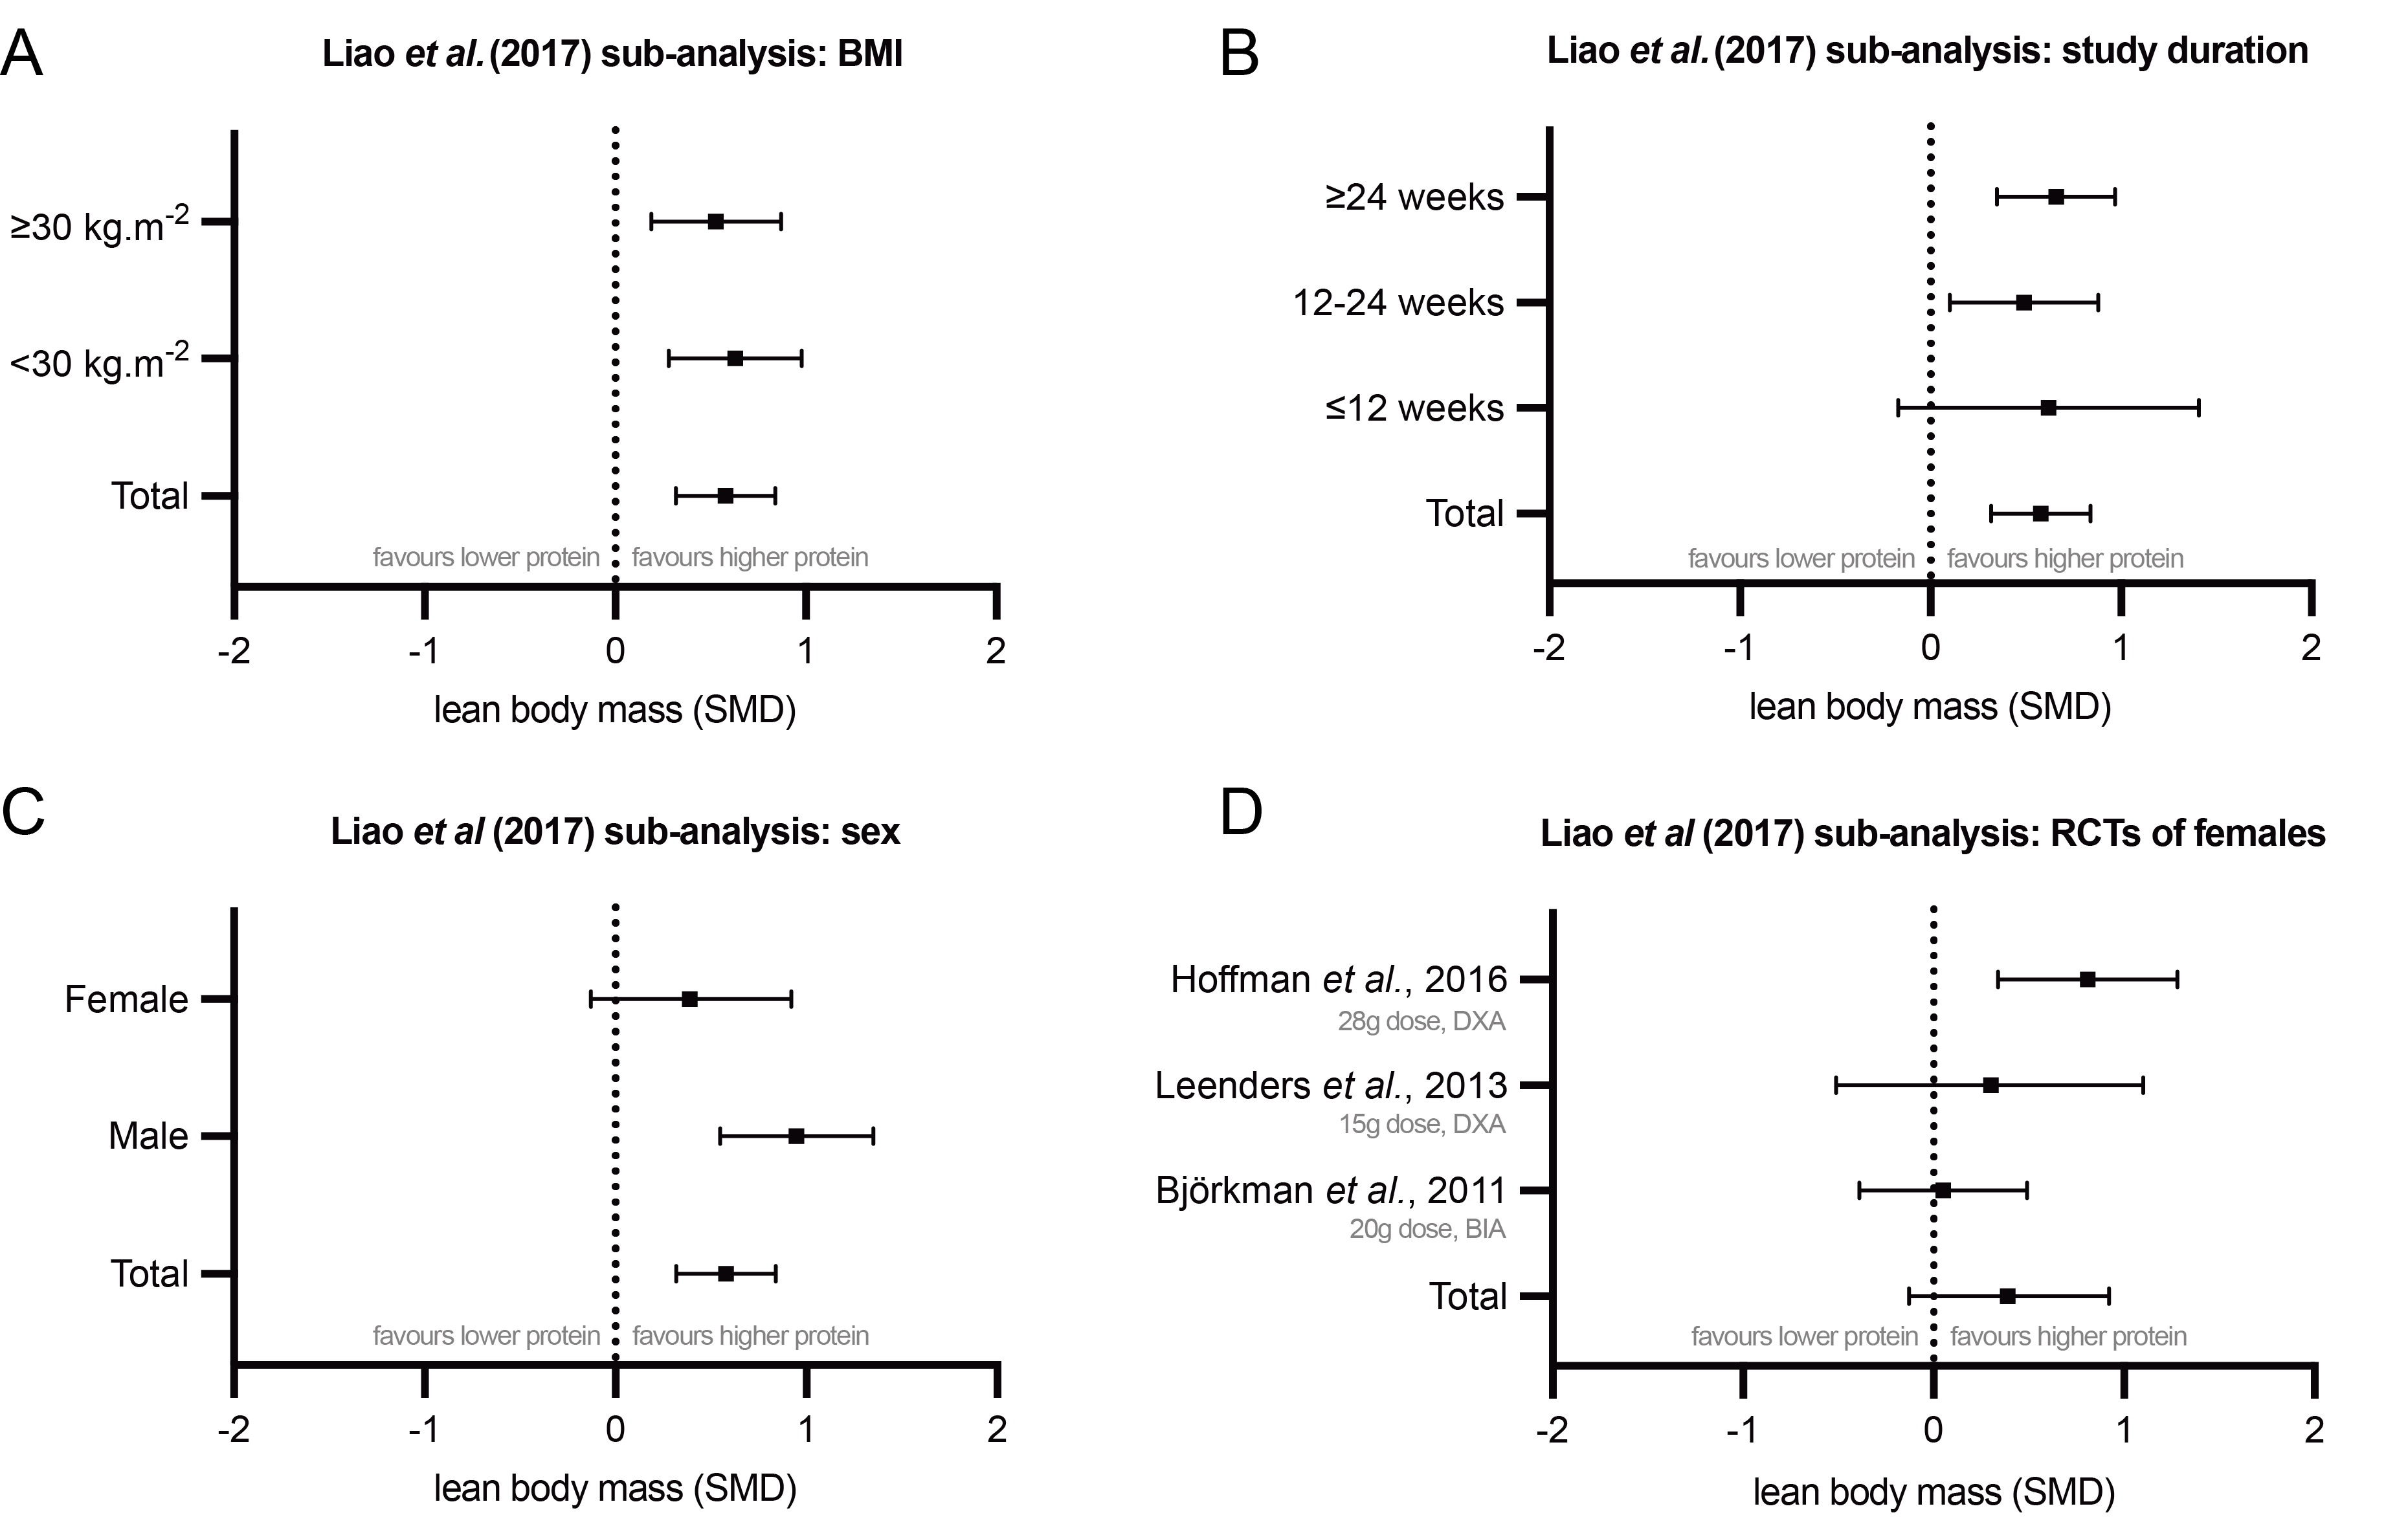
The authors also performed valuable subgroup analyses. Firstly, they found that being obese did not change the benefit of increased protein (Figure 1A). Secondly, they found that shorter intervention periods led to greater heterogeneity in results, with improvements from protein plus resistance training becoming non-significant with interventions under 12 weeks in duration (Figure 1B). This is instructive for other meta-analyses, since many include RCTs with very short interventions. Longer interventions create more consistent effects, and these effects are in favour of higher protein.
Interestingly, when separating RCTs by sex of the participants, the researchers found no beneficial effect of increased protein for women (Figure 1C). This has led many to believe that only men stand to gain from high protein diets, yet this interpretation should be made with caution. There were only three RCTs which included women:
One 8-week trial of resistance training elderly polymyalgia rheumatica patients supplemented the intervention group with 28 g of protein per day and found a significant increase in lean body mass as measured by for Dual-energy X-ray Absorptiometry (DXA)—the gold standard for such measurements [47].
A second study supplemented resistance training elderly individuals with only 15 g of protein per day and found no significant improvement from protein supplementation on DXA-determined lean body mass [48]. Doses of 20-40 g are typically recommended to sufficiently stimulate muscle protein synthesis [49]. Given that the elderly require even higher doses of protein to stimulate muscle protein synthesis to the same degree as younger populations [50,51], it is unsurprising that this trial of 15 g doses did not produce significantly greater lean mass gains.
The third trial supplemented elderly women exercising with resistance bands with 20 g of protein per day, which may still be insufficient to stimulate muscle protein synthesis in this population, and measured lean body mass with bioelectrical impedance analysis (BIA) [52]. While BIA is easier to implement and correlates reasonably well with DXA measurements, it has been shown to be less accurate and consistently overestimate fat-free mass (FFM) and underestimate fat mass [53–55].
As such, the null results of the latter two studies can be explained by significant experimental limitations. In this instance, interpreting individual studies might be more informative than a meta-analysis of three RCTs with very heterogenous study designs. At the very least, given the preponderance of evidence that higher protein intakes offer improved outcomes for resistance training in other populations, more studies on elderly women are required before making firm conclusions that higher protein intakes are ineffective in this subgroup.
Beyond this subgroup analysis, Liao and colleagues do not offer dose-specific insights. In elderly and overweight populations, higher protein intakes are therefore recommended with no upper limit.
Morton et al., 2018
While recommendations for the elderly are important, health and healthspan recommendations should target all ages. This is especially true regarding muscle mass and strength, since accumulating more during early and midlife would offset age-related losses independently of interventions late in life.
Morton and colleagues performed a meta-analysis of 49 RCTs on healthy adults of all ages with resistance training. They found that increased protein intake led to significantly greater FFM, strength, and muscle size gains compared to resistance training alone [44].
Subgroup analysis led the authors to make two additional conclusions: the benefit of higher protein decreased with age, and higher protein intakes were less effective when participants were completely untrained prior to the study.
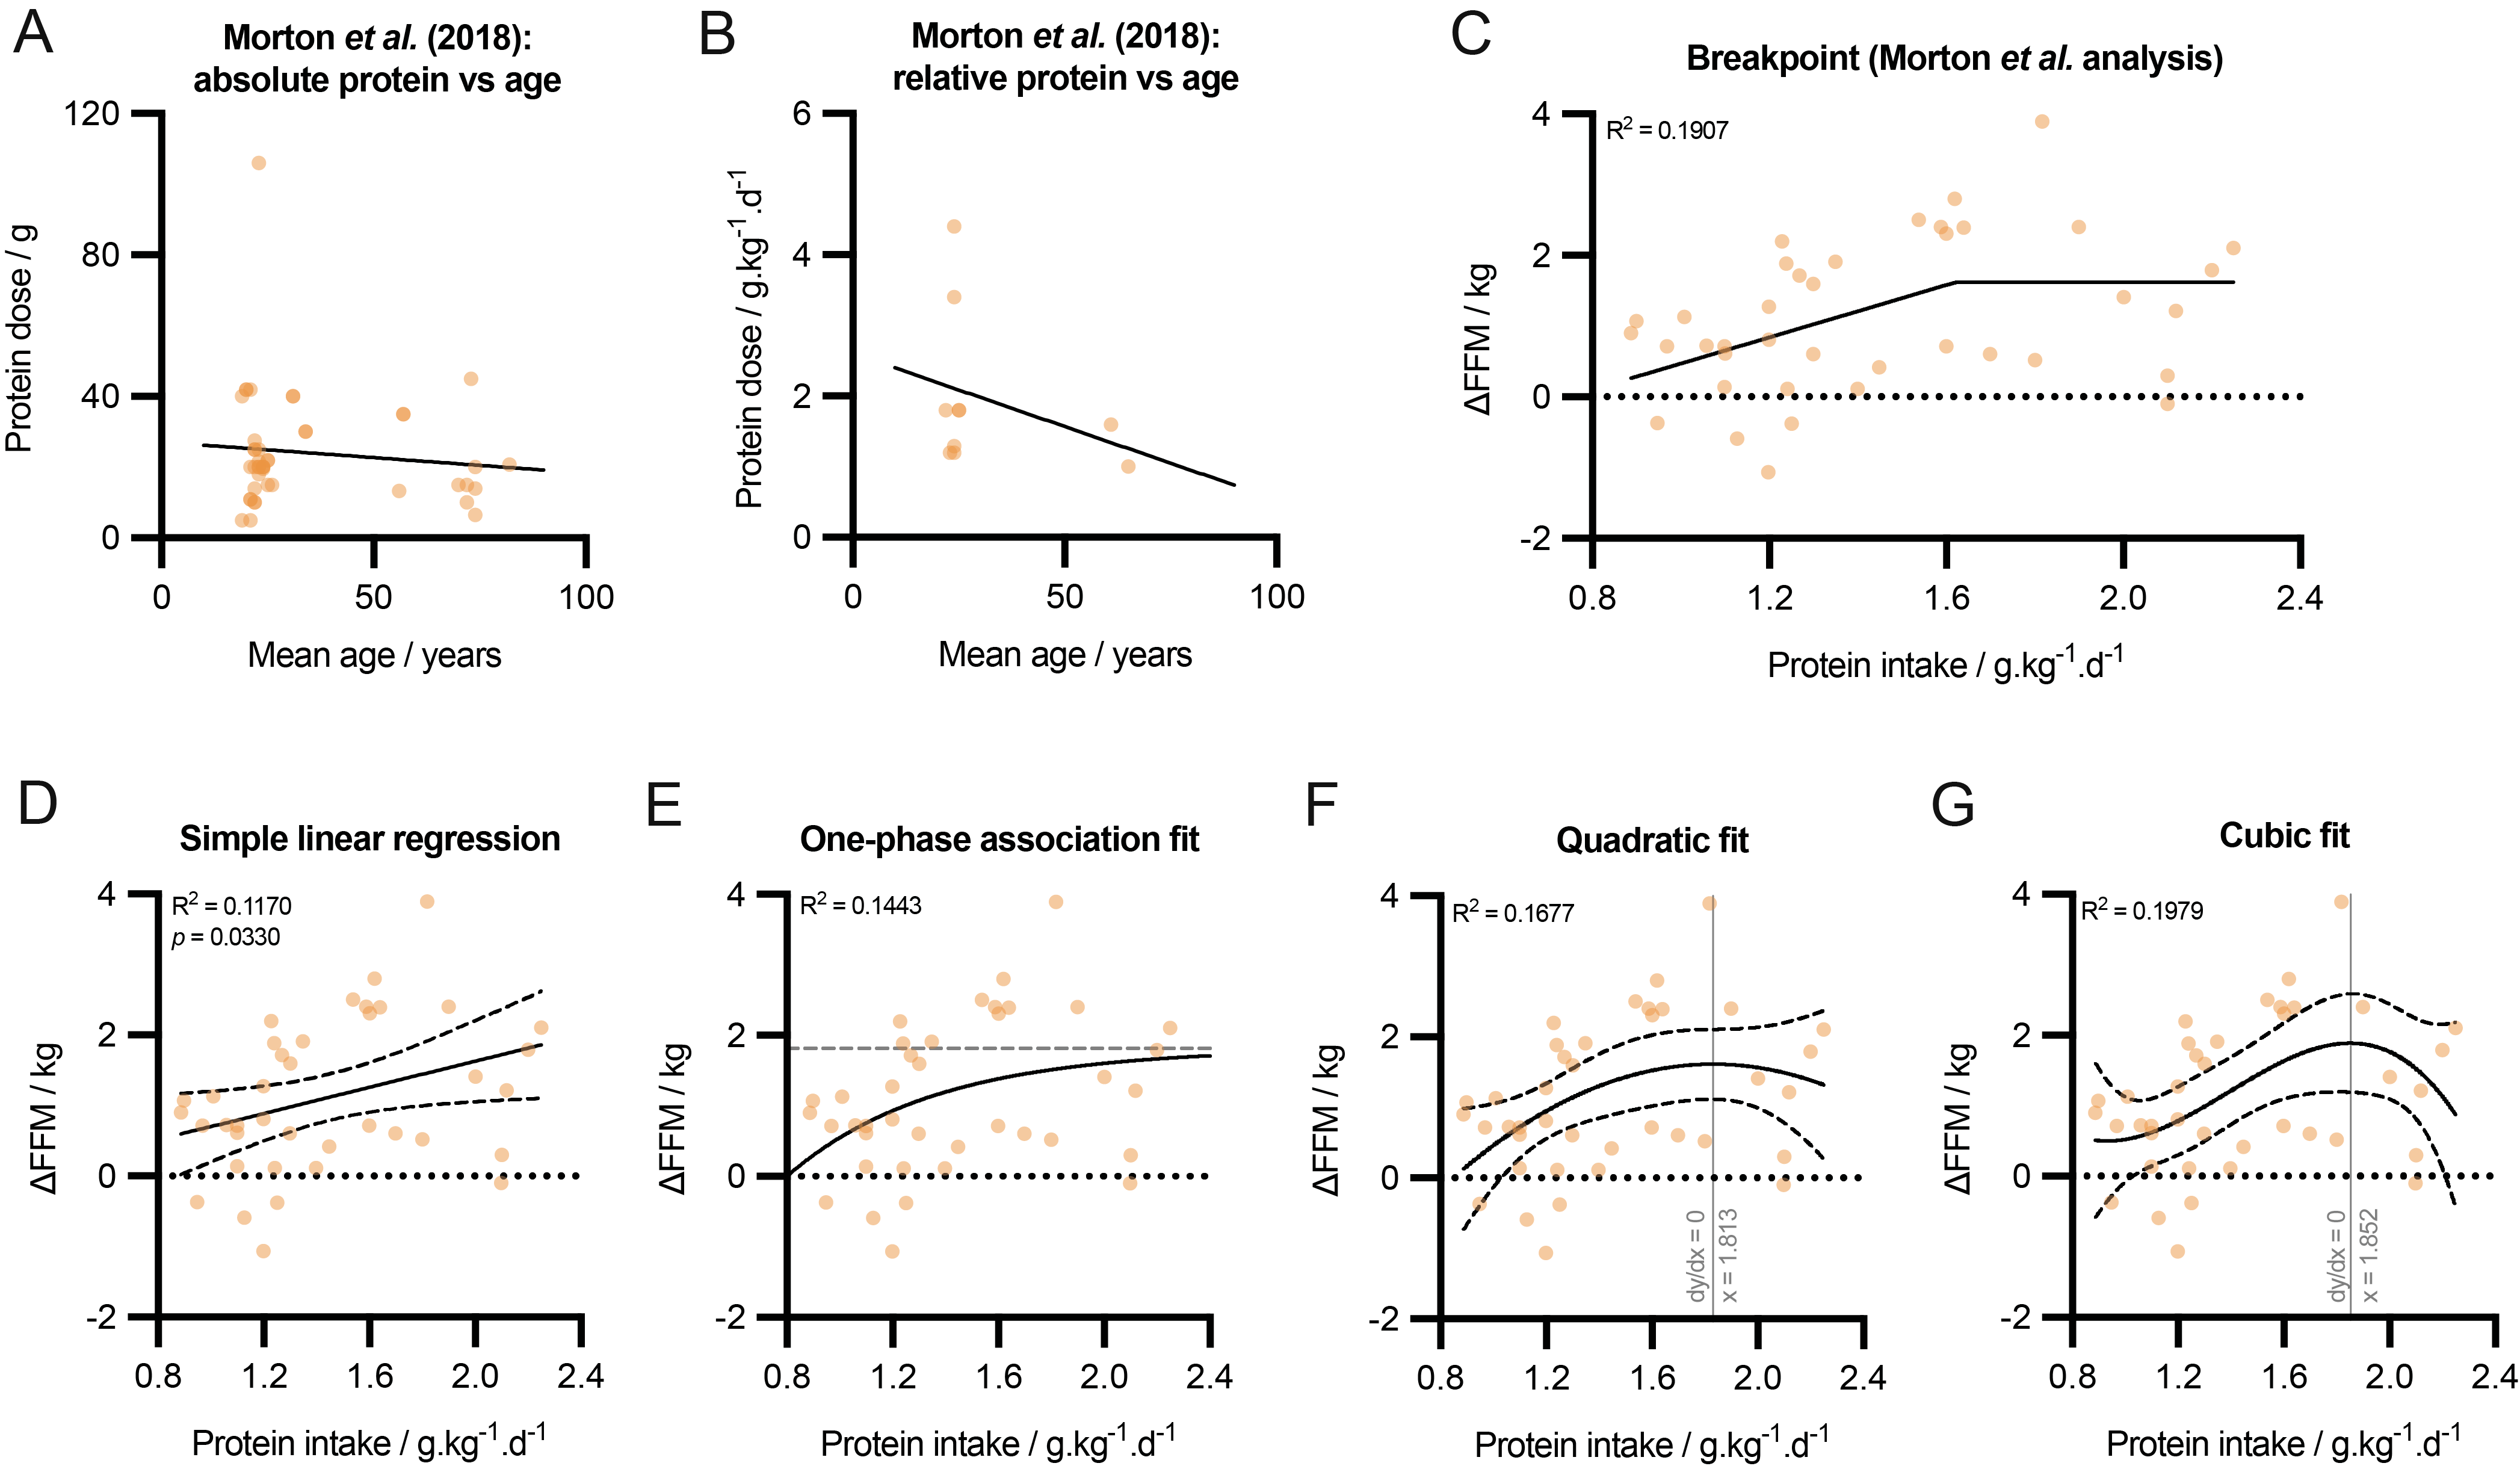
The diminishing effect of age here is based on a univariate analysis, which showed that age was significantly inversely correlated with protein-induced improvements in FFM (β = -0.01, p = 0.02). Yet when multivariate meta-regression was applied, which took into account any mediating effect of protein dose, age no longer significantly affected ΔFFM outcomes (β = -0.01, p = 0.19). Plotting protein dose against age reveals why this is the case: RCTs on older participants tended to use smaller protein doses (Figure 2A, B). Thus, with protein dose removed as a mediator, there is no evidence that older individuals do not benefit from higher protein intakes when undertaking resistance training. Indeed, as previously mentioned, older participants likely need even more protein to elicit the same benefit [50,51], and future RCTs on this demographic subgroup should endeavour to test higher doses of protein supplementation.
The greater benefit of higher protein intakes with concomitant resistance training in habitually trained individuals is a well-recognised phenomenon. This likely comes about since the effect size of the training alone is so large for previously untrained individuals (a phenomenon colloquially referred to as “newbie gains”), that any further benefit induced by diet is relatively small. Morton et al. found that the benefit of high protein intake on ΔFFM in untrained individuals was small in effect size and non-significant (+0.15 kg; 95% CI: −0.02, +0.31; p = 0.08), but large and significant in trained individuals (+1.05 kg; 95% CI: +0.61, +1.50), p<0.0001) [44]. The strong empirical evidence for this phenomenon presented by Morton and colleagues should be instructive for other meta-analyses, which often do not separate untrained from trained subjects. Given that resistance training is recommended for health and healthspan, recommendations for protein intake should be made primarily on the basis of RCTs on trained individuals.
Combining RCTs on both untrained and trained individuals, Morton et al. next analysed the relationship between daily protein intake and ΔFFM. They chose to model their data via segmental regression (“breakpoint analysis”) which fixed a horizontal line from 1.62 g/kg/d and above (Figure 2C). They chose this model because it explained more variance (R2 = 0.1907) than a simple linear regression (R2 = 0.1170, p = 0.0330) (Figure 2D). This choice of model has led to interpretations that there is no benefit of increasing protein intake beyond 1.6 g/kg/d. However, the same data can be fitted with a one-phase association curve (R2 = 0.1443) (Figure 2E), a quadratic curve (R2 = 0.1677) (Figure 2F), or a cubic curve (R2 = 0.1979) (Figure 2G).
The best fitting model here is the cubic curve, which has a local maximum at 1.852 g/kg/d. Nonetheless, given that these data include both trained and untrained subjects, and the models all fit the heterogenous data quite poorly, caution should be taken before recommending optimal protein intakes from this dataset. It is also worth noting that ΔFFM is one beneficial outcome of a high protein diet. Even if protein intakes above 1.85 g/kg/d do not result in further gains in FFM, there may still be added benefit for fat loss or muscle function/strength.
ten Haaff et al., 2018
A meta-analysis of 36 RCTs of old (>50 years old) non-frail adults both with and without resistance training was performed by ten Haaff and colleagues [46]. They posited that frail elderly adults are more likely than non-frail individuals to benefit from high protein intakes, and so sought to test non-frail populations specifically. They found no significant enhancement of lean body mass or muscle strength/function in this population either with or without resistance training. This meta-analysis stands out as the only one of the seven reviewed here to show a null result for protein supplementation.
The most obvious reason for these null results relates to the phenomenon observed in Morton et al. (2018) [44]: protein interventions in RCTs on older adults tend to be very low. Many of the RCTs in this meta-analysis use doses of 15 g of protein or less, which is insufficient to stimulate muscle protein synthesis in young individuals, let alone old individuals. Of those RCTs that use higher doses (~25 g), many only implement these doses three days per week. Indeed, the authors themselves admit that “the protein supplementation protocol could have been suboptimal in some studies”.
The inferior protein interventions deployed by the RCTs in this meta-analysis make it difficult to form meaningful conclusions. Future RCTs of non-frail over-50s should aim to implement doses more likely to be effective (>25g per day) [56,57].
Tagawa et al., 2020
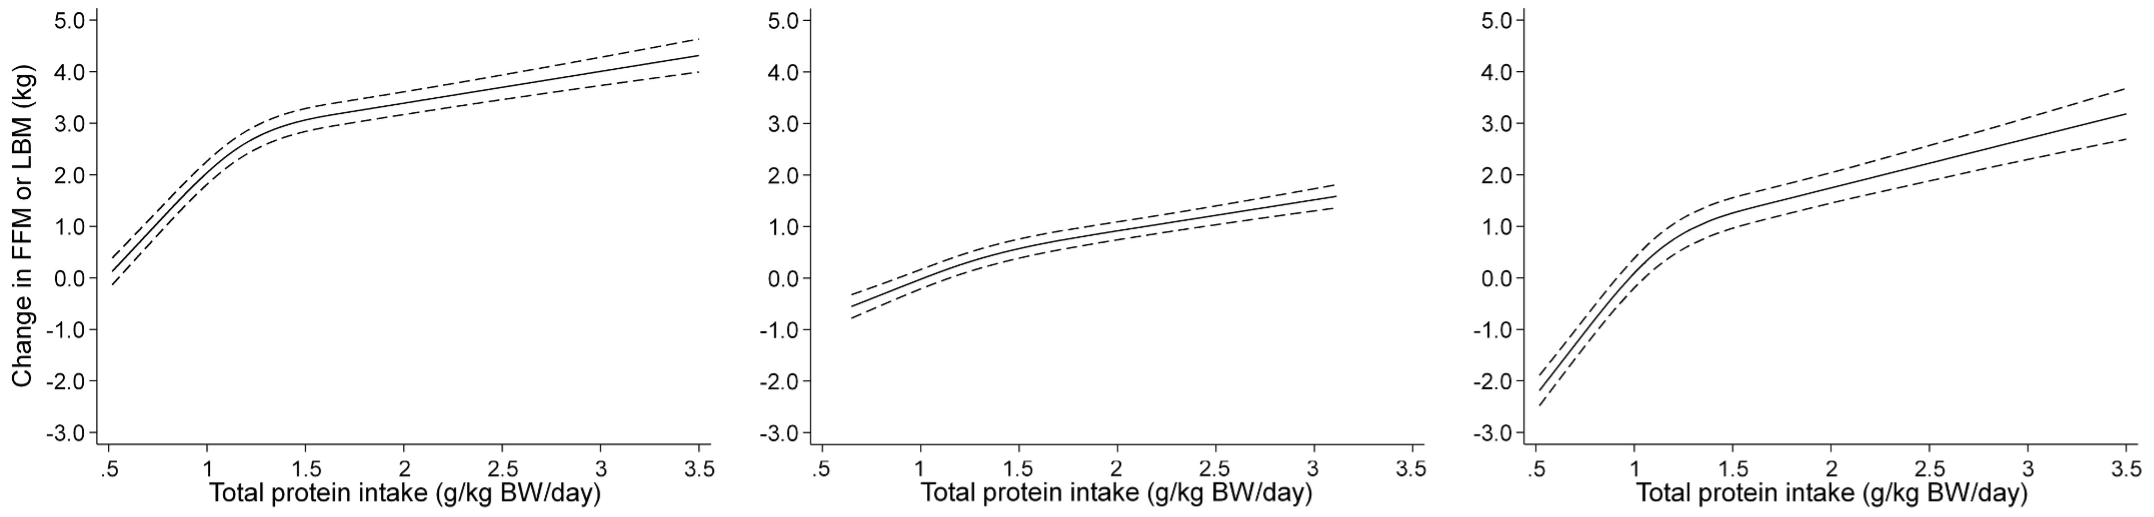
The largest meta-analysis investigating the effects of protein intake ± resistance training on muscle mass was performed by Tagawa and colleagues, and included 105 RCTs of all non-critically ill adults over a range of dietary settings [42]. By casting such a wide net, the authors sought to impute a dose-response curve, which would inform optimal daily protein intake recommendations. They generated spline curves to model the data and determine the dose-response relationship between daily protein intake and ΔFFM or lean body mass (Figure 3). Adjusting for age, sex, intervention period, and resistance training volume, they found that increasing protein intake always resulted in greater gains in FFM—even beyond 3 g/kg/d. In individuals not engaged in resistance training, diminishing returns were observed beyond 1.3 g/kg/d, but when subjects were concomitantly engaged in resistance training, the dose-response relationship was remarkably linear (Figure 3, middle panel).
This dose-response model has substantially tighter confidence intervals that those generated from Morton et al. (2018), likely due to better adjustment for co-variates and more data (105 RCTs versus 45 RCTs). This meta-analysis offers convincing evidence that lean body mass gains are superior with a higher protein diet at all ranges of protein intake, and that concomitant resistance training maximises the benefit of increases above 1.3 g/kg/d.
Nunes et al., 2022
The notion that higher intakes of protein across a wide range of intakes leads to greater lean body mass gains with concomitant resistance training was corroborated by a meta-analysis of 66 RCTs by Nunes and colleagues on healthy adults of all ages [41]. They found significant benefits of higher protein in resistance training individuals on lean body mass gains (SMD = +0.19; 95% CI: 0.11, 0.28) and also lower body strength gains (SMD = 0.21; 95% CI: 0.08, 0.34).
Subdividing protein intake into three strata revealed no significant benefit of protein intakes below 1.2 g/kg/d on lean body mass (SMD = -0.14; 95% CI: -0.56, 0.27), a modest and significant benefit between 1.2 g/kg/d and 1.6 g/kg/d (SMD = +0.17; 95% CI: 0.06, 0.28), and a large and significant benefit above 1.6 g/kg/d (SMD = +0.30; 95% CI: 0.17, 0.43). This three-level meta-regression directly supports the notion that RCTs where protein doses are too low are unlikely to show an added benefit of protein supplementation with resistance training on lean body mass (as is the case for many RCTs on older subjects—as discussed earlier in the context of the meta-analysis by ten Haaff and colleagues [46]). This same phenomenon was observed for strength gains, with only the highest substratum of protein intake (>1.6 g/kg/d) receiving a significant benefit from their additional protein intake (SMD = 0.40; 95% CI: 0.23, 0.57). Contrary to the assertion that there is little added value of increasing protein intake beyond 1.6 g/kg/d, this meta-analysis offers strong support that intakes above 1.6 g/kg/d are the most beneficial for resistance-training individuals.
Kokura et al., 2024
Focusing on overweight or obese individuals aiming to lose weight, Kokura and colleagues performed a meta-analysis of 28 RCTs investigating the effect of higher protein intakes on muscle mass retention [40]. They found that higher protein intakes were significantly protective against loss of muscle mass during weight loss (SMD = +0.75; 95% CI: 0.41, 1.10). Analysing the dose-response relationship in this context of caloric restriction, they found that protein intakes below 1.0 g/kg/d were detrimental for muscle mass retention, while intakes above 1.3 g/kg/d could not only prevent loss of muscle mass, but increase muscle mass. They found no significant benefit on strength from higher protein intakes, which is unsurprising given only eight of the included RCTs included concomitant resistance training.
This meta-analysis, while focusing on overweight individuals aiming for weight loss and mostly not undergoing resistance training, adds further weight to the recommendation that higher protein intakes (of at least 1.3 g/kg/d in this case) are beneficial for lean body mass.
Refalo et al., 2025
While most of the RCTs in the meta-analysis by Kokura and colleagues did not include resistance training, and all participants were overweight or obese, Refalo and colleagues exclusively focused on the effects of protein intake on FFM in calorically restricted non-obese individuals undertaking resistance training [45]. Further, all participants were experienced in resistance training prior to the study. These inclusion criteria make this meta-analysis of 29 RCTs highly relevant to healthy populations already following resistance training recommendations.
To model the dose-response relationship between protein intake and ΔFFM, the authors deployed a Bayesian approach to compare models. Contrary to previous indications of diminishing returns with higher protein intakes, they found that the dose-response relationship was linear with >97% probability, and that the linear model outperformed other non-linear models via Bayes Factor analysis. The benefit of higher protein for FFM was stronger in longer trials (>4 weeks), if participants had lower baseline bodyfat percentages, and in men. Including random effects, the linear model explained 55% of the variance (R2conditional = 0.55) [45].
This statistically robust meta-analysis with stringent inclusion criteria corroborates the subgroup analysis on resistance training individuals by Tagawa and colleagues, which also showed a linear dose-response relationship after covariate adjustment (Figure 3) [42], but in the context of caloric restriction. Refalo and colleagues conclude that protein intakes up to 2.5 g/kg/d are associated with greater preservation of FFM during caloric restriction, and that increasing this further up to 4.2 g/kg/d (the highest dose of included RCTs) is “linearly associated with larger FFM gain”.
Summary and conclusions
Governmental recommendations for protein intakes were designed to prevent deficiency, not to optimise health. The updated AMDR recommendation for protein intake provides a very wide range (0.8 – 2.8 g/kg/d), which leaves a lot of room for dispute.
Many worry that excessively high protein intakes might be harmful, or that benefits wane beyond a certain threshold, yet these concerns are not evidence-based. Evidence of harm—either via glucose control, mTOR activation in immune cells, or on kidney function—is not seen in studies of healthy humans. There is evidence that chronic kidney disease patients may be able to slow rate of disease progression by restricting protein intake, but all-cause mortality risk is not improved by doing so [24]. At the population level, vast quantities of observational data show that higher protein intakes increase healthspan and lifespan, particularly when saturated fatty acids and ultra-processed foods are accounted for or avoided.
Higher protein intakes are beneficial for satiety, fat loss, muscle gain/retention, and muscle strength/function—all of which improve quality of life, health, healthspan, and lifespan. By careful review and interpretation of seven relevant meta-analyses, this review converges on the conclusion that higher protein intakes improve muscle mass accretion (or retention in a caloric deficit) at all ranges of protein intakes for young, old, healthy, and obese populations. In non-resistance-training populations, the additional benefit beyond 1.3 g/kg/d lowers—reflecting continued but diminishing returns here [42]. For resistance-training individuals, however, multiple large, well-designed, and statistically robust meta-analyses converge on the notion that the dose-response relationship between protein intake and ΔFFM is linear [41,42,45]. There is strong evidence that higher protein intakes accentuate strength gains induced by resistance training too. In older populations, a large number of RCTs have used suboptimal protein intervention doses, which can skew meta-analyses of these studies. The well-documented necessity for higher protein doses in elderly populations should be incorporated into future RCTs of the elderly.
Since resistance training is already recommended for most people to optimise health, the optimal protein intake for a resistance-training individual should be calculated via cost-benefit analysis that assumes that health benefits scale linearly, and that minimises economic-, convenience-, and preference-based costs primarily—since there is little evidence for any health-based costs of high protein intakes. For many, this number will emerge at the upper end of the AMDR recommendation, upwards of 2.2 g/kg/d.
Methods
Search strategy and selection criteria
Meta-analyses of RCTs investigating the effects of protein on muscle mass were identified by searches of PubMed and GoogleScholar using combinations of the search terms “protein”, “supplementation”, “muscle mass”, “lean body mass”, “fat-free mass”, “resistance training”, “meta-analysis”, and “RCT”. Only meta-analyses published in English between 2015 and 2025 were included.
Data extraction, statistical analysis, and data plotting
Where data was not directly available from the main meta-analysis article or its supplementary data, Plot Digitizer (https://plotdigitizer.com/) was used to extract values from charts. This was only required for re-analysis of Morton et al. (2018) [44]. Re-plotting and modelling of data and all statistical analyses was performed with Prism (Version 10.6.1, GraphPad).
Funding and conflicts of interest
This Review was not supported by any grant or funding source and the author declares no conflicts of interest.
References
1. Deaths from protein-energy malnutrition, by age, World Our world in data. https://ourworldindata.org/grapher/malnutrition-deaths-by-age.
2. Rand, W.M., Pellett, P.L., and Young, V.R. (2003). Meta-analysis of nitrogen balance studies for estimating protein requirements in healthy adults. American Journal of Clinical Nutrition 77, 109–127. https://doi.org/10.1093/ajcn/77.1.109.
3. Wolfe, R.R., Cifelli, A.M., Kostas, G., and Kim, I.Y. (2017). Optimizing Protein Intake in Adults: Interpretation and Application of the Recommended Dietary Allowance Compared with the Acceptable Macronutrient Distribution Range. Advances in Nutrition 8, 266. https://doi.org/10.3945/AN.116.013821.
4. Bauer, J., Biolo, G., Cederholm, T., Cesari, M., Cruz-Jentoft, A.J., Morley, J.E., Phillips, S., Sieber, C., Stehle, P., Teta, D., et al. (2013). Evidence-Based Recommendations for Optimal Dietary Protein Intake in Older People: A Position Paper From the PROT-AGE Study Group. J Am Med Dir Assoc 14, 542–559. https://doi.org/10.1016/J.JAMDA.2013.05.021.
5. Mittendorfer, B., Klein, S., and Fontana, L. (2019). A word of caution against excessive protein intake. Nature Reviews Endocrinology 2019 16:1 16, 59–66. https://doi.org/10.1038/s41574-019-0274-7.
6. Campbell, B., Kreider, R.B., Ziegenfuss, T., La Bounty, P., Roberts, M., Burke, D., Landis, J., Lopez, H., and Antonio, J. (2007). International Society of Sports Nutrition position stand: Protein and exercise. J Int Soc Sports Nutr 4, 8-. https://doi.org/10.1186/1550-2783-4-8
7. Lee, D.H., Rezende, L.F.M., Joh, H.K., Keum, N., Ferrari, G., Rey-Lopez, J.P., Rimm, E.B., Tabung, F.K., and Giovannucci, E.L. (2022). Long-Term Leisure-Time Physical Activity Intensity and All-Cause and Cause-Specific Mortality: A Prospective Cohort of US Adults. Circulation 146, 523–534. https://doi.org/10.1161/CIRCULATIONAHA.121.058162
8. Raafs, B.M., Karssemeijer, E.G.A., van der Horst, L., Aaronson, J.A., Olde Rikkert, M.G.M., and Kessels, R.P.C. (2020). Physical Exercise Training Improves Quality of Life in Healthy Older Adults: A Meta-Analysis. J Aging Phys Act 28, 81–93. https://doi.org/10.1123/JAPA.2018-0436.
9. Lenharo, M. (2025). How much protein do you really need? What the science says. Nature 647, 304–305. https://doi.org/10.1038/D41586-025-03632-1.
10. Topol, E. (2025). Our Preoccupation With Protein Intake. https://erictopol.substack.com/p/our-preoccupation-with-protein-intake.
11. Srikanthan, P., and Karlamangla, A.S. (2014). Muscle Mass Index as a Predictor of Longevity in Older-Adults. Am J Med 127, 547. https://doi.org/10.1016/J.AMJMED.2014.02.007.
12. Xia, L., Zhao, R., Wan, Q., Wu, Y., Zhou, Y., Wang, Y., Cui, Y., Shen, X., and Wu, X. (2020). Sarcopenia and adverse health‐related outcomes: An umbrella review of meta‐analyses of observational studies. Cancer Med 9, 7964. https://doi.org/10.1002/CAM4.3428.
13. Celis-Morales, C.A., Welsh, P., Lyall, D.M., Steell, L., Petermann, F., Anderson, J., Iliodromiti, S., Sillars, A., Graham, N., MacKay, D.F., et al. (2018). Associations of grip strength with cardiovascular, respiratory, and cancer outcomes and all cause mortality: prospective cohort study of half a million UK Biobank participants. BMJ 361. https://doi.org/10.1136/BMJ.K1651.
14. Pinto Pereira, S.M., Garfield, V., Farmaki, A.E., Tomlinson, D.J., Norris, T., Fatemifar, G., Denaxas, S., Finan, C., and Cooper, R. (2022). Adiposity and grip strength: a Mendelian randomisation study in UK Biobank. BMC Med 20, 201. https://doi.org/10.1186/S12916-022-02393-2.
15. Norris, T., Cooper, R., Garfield, V., Hamer, M., and Pinto Pereira, S.M. (2024). Unpicking Causal Relationships Between Grip Strength and Cardiorespiratory Fitness: A Bidirectional Mendelian Randomization Study. Scand J Med Sci Sports 34. https://doi.org/10.1111/SMS.14775.
16. Hart, P.D., and Buck, D.J. (2019). The effect of resistance training on health-related quality of life in older adults: Systematic review and meta-analysis. Health Promot Perspect 9, 1. https://doi.org/10.15171/HPP.2019.01.
17. Shailendra, P., Baldock, K.L., Li, L.S.K., Bennie, J.A., and Boyle, T. (2022). Resistance Training and Mortality Risk: A Systematic Review and Meta-Analysis. Am J Prev Med 63, 277–285. https://doi.org/10.1016/j.amepre.2022.03.020.
18. Zhang, X., Kapoor, D., Jeong, S.J., Fappi, A., Stitham, J., Shabrish, V., Sergin, I., Yousif, E., Rodriguez-Velez, A., Yeh, Y.S., et al. (2024). Identification of a leucine-mediated threshold effect governing macrophage mTOR signalling and cardiovascular risk. Nature Metabolism 2024 6:2 6, 359–377. https://doi.org/10.1038/s42255-024-00984-2.
19. Zhang, X., Sergin, I., Evans, T.D., Jeong, S.J., Rodriguez-Velez, A., Kapoor, D., Chen, S., Song, E., Holloway, K.B., Crowley, J.R., et al. (2020). High-protein diets increase cardiovascular risk by activating macrophage mTOR to suppress mitophagy. Nature Metabolism 2020 2:1 2, 110–125. https://doi.org/10.1038/s42255-019-0162-4.
20. Dickinson, J.M., Fry, C.S., Drummond, M.J., Gundermann, D.M., Walker, D.K., Glynn, E.L., Timmerman, K.L., Dhanani, S., Volpi, E., and Rasmussen, B.B. (2011). Mammalian Target of Rapamycin Complex 1 Activation Is Required for the Stimulation of Human Skeletal Muscle Protein Synthesis by Essential Amino Acids1–3. J Nutr 141, 856–862. https://doi.org/10.3945/JN.111.139485.
21. Song, Z., Moore, D.R., Hodson, N., Ward, C., Dent, J.R., O’Leary, M.F., Shaw, A.M., Hamilton, D.L., Sarkar, S., Gangloff, Y.G., et al. (2017). Resistance exercise initiates mechanistic target of rapamycin (mTOR) translocation and protein complex co-localisation in human skeletal muscle. Scientific Reports 2017 7:1 7, 5028-. https://doi.org/10.1038/s41598-017-05483-x.
22. Fappi, A., and Mittendorfer, B. (2020). Dietary protein intake and obesity-associated cardiometabolic function. Curr Opin Clin Nutr Metab Care 23, 380–386. https://doi.org/10.1097/MCO.0000000000000689.
23. Ang, T., Bruce, C.R., and Kowalski, G.M. (2019). Postprandial Aminogenic Insulin and Glucagon Secretion Can Stimulate Glucose Flux in Humans. Diabetes 68, 939–946. https://doi.org/10.2337/DB18-1138.
24. Yan, B., Su, X., Xu, B., Qiao, X., and Wang, L. (2018). Effect of diet protein restriction on progression of chronic kidney disease: A systematic review and meta-analysis. PLoS One 13. https://doi.org/10.1371/JOURNAL.PONE.0206134.
25. Devries, M.C., Sithamparapillai, A., Brimble, K.S., Banfield, L., Morton, R.W., and Phillips, S.M. (2018). Changes in Kidney Function Do Not Differ between Healthy Adults Consuming Higher- Compared with Lower- or Normal-Protein Diets: A Systematic Review and Meta-Analysis. Journal of Nutrition 148, 1760–1775. https://doi.org/10.1093/jn/nxy197.
26. Cheng, Y., Zheng, G., Song, Z., Zhang, G., Rao, X., and Zeng, T. (2024). Association between dietary protein intake and risk of chronic kidney disease: a systematic review and meta-analysis. Front Nutr 11. https://doi.org/10.3389/FNUT.2024.1408424.
27. Chen, Z., Glisic, M., Song, M., Aliahmad, H.A., Zhang, X., Moumdjian, A.C., Gonzalez-Jaramillo, V., van der Schaft, N., Bramer, W.M., Ikram, M.A., et al. (2020). Dietary protein intake and all-cause and cause-specific mortality: results from the Rotterdam Study and a meta-analysis of prospective cohort studies. Eur J Epidemiol 35, 411–429. https://doi.org/10.1007/S10654-020-00607-6.
28. Naghshi, S., Sadeghi, O., Willett, W.C., and Esmaillzadeh, A. (2020). Dietary intake of total, animal, and plant proteins and risk of all cause, cardiovascular, and cancer mortality: systematic review and dose-response meta-analysis of prospective cohort studies. BMJ 370, 2412. https://doi.org/10.1136/BMJ.M2412.
29. Wallerer, S., Papakonstantinou, T., Morze, J., Stadelmaier, J., Kiesswetter, E., Gorenflo, L., Barbaresko, J., Szczerba, E., Neuenschwander, M., Bell, W., et al. (2024). Association between substituting macronutrients and all-cause mortality: a network meta-analysis of prospective observational studies. EClinicalMedicine 75, 102807. https://doi.org/10.1016/j.eclinm.2024.102807.
30. Kurata, H., Meguro, S., Abe, Y., Sasaki, T., Asakura, K., Arai, Y., and Itoh, H. (2023). Dietary protein intake and all-cause mortality: results from The Kawasaki Aging and Wellbeing Project. BMC Geriatrics 2023 23:1 23, 479-. https://doi.org/10.1186/S12877-023-04173-W.
31. Dicken, S.J., Jassil, F.C., Brown, A., Kalis, M., Stanley, C., Ranson, C., Ruwona, T., Qamar, S., Buck, C., Mallik, R., et al. (2025). Ultraprocessed or minimally processed diets following healthy dietary guidelines on weight and cardiometabolic health: a randomized, crossover trial. Nat Med 31, 3297–3308. https://doi.org/10.1038/S41591-025-03842-0;SUBJMETA.
32. Rohrmann, S., Overvad, K., Bueno-de-Mesquita, H.B., Jakobsen, M.U., Egeberg, R., Tjønneland, A., Nailler, L., Boutron-Ruault, M.C., Clavel-Chapelon, F., Krogh, V., et al. (2013). Meat consumption and mortality - results from the European Prospective Investigation into Cancer and Nutrition. BMC Medicine 2013 11:1 11, 63-. https://doi.org/10.1186/1741-7015-11-63.
33. Kaluza, J., Akesson, A., and Wolk, A. (2014). Processed and unprocessed red meat consumption and risk of heart failure prospective study of men. Circ Heart Fail 7, 552–557. https://doi.org/10.1161/CIRCHEARTFAILURE.113.000921
34. Ramezani, F., Pourghazi, F., Eslami, M., Gholami, M., Mohammadian Khonsari, N., Ejtahed, H.S., Larijani, B., and Qorbani, M. (2024). Dietary fiber intake and all-cause and cause-specific mortality: An updated systematic review and meta-analysis of prospective cohort studies. Clinical Nutrition 43, 65–83. https://doi.org/10.1016/j.clnu.2023.11.005.
35. Liao, C. De, Huang, S.W., Chen, H.C., Huang, M.H., Liou, T.H., and Lin, C.L. (2024). Comparative Efficacy of Different Protein Supplements on Muscle Mass, Strength, and Physical Indices of Sarcopenia among Community-Dwelling, Hospitalized or Institutionalized Older Adults Undergoing Resistance Training: A Network Meta-Analysis of Randomi…. Nutrients 16, 941. https://doi.org/10.3390/NU16070941.
36. Reid-Mccann, R.J., Brennan, S.F., Ward, N.A., Logan, D., McKinley, M.C., and McEvoy, C.T. (2025). Effect of Plant Versus Animal Protein on Muscle Mass, Strength, Physical Performance, and Sarcopenia: A Systematic Review and Meta-analysis of Randomized Controlled Trials. Nutr Rev 83, e1581–e1603. https://doi.org/10.1093/NUTRIT/NUAE200.
37. Ardisson Korat, A. V., Shea, M.K., Jacques, P.F., Sebastiani, P., Wang, M., Eliassen, A.H., Willett, W.C., and Sun, Q. (2024). Dietary protein intake in midlife in relation to healthy aging – results from the prospective Nurses’ Health Study cohort. Am J Clin Nutr 119, 271–282. https://doi.org/10.1016/J.AJCNUT.2023.11.010.
38. Dhillon, J., Craig, B.A., Leidy, H.J., Amankwaah, A.F., Osei-Boadi Anguah, K., Jacobs, A., Jones, B.L., Jones, J.B., Keeler, C.L., Keller, C.E.M., et al. (2016). The Effects of Increased Protein Intake on Fullness: A Meta-Analysis and Its Limitations. J Acad Nutr Diet 116, 968–983. https://doi.org/10.1016/j.jand.2016.01.003.
39. Kohanmoo, A., Faghih, S., and Akhlaghi, M. (2020). Effect of short- and long-term protein consumption on appetite and appetite-regulating gastrointestinal hormones, a systematic review and meta-analysis of randomized controlled trials. Physiol Behav 226. https://doi.org/10.1016/j.physbeh.2020.113123.
40. Kokura, Y., Ueshima, J., Saino, Y., and Keisuke, M. (2024). Enhanced protein intake on maintaining muscle mass, strength, and physical function in adults with overweight/obesity: A systematic review and meta-analysis. Clin Nutr ESPEN 63, 417–426. https://doi.org/10.1016/J.CLNESP.2024.06.030.
41. Nunes, E.A., Colenso-Semple, L., McKellar, S.R., Yau, T., Ali, M.U., Fitzpatrick-Lewis, D., Sherifali, D., Gaudichon, C., Tomé, D., Atherton, P.J., et al. (2022). Systematic review and meta‐analysis of protein intake to support muscle mass and function in healthy adults. J Cachexia Sarcopenia Muscle 13, 795. https://doi.org/10.1002/JCSM.12922.
42. Tagawa, R., Watanabe, D., Ito, K., Ueda, K., Nakayama, K., Sanbongi, C., and Miyachi, M. (2021). Dose–response relationship between protein intake and muscle mass increase: a systematic review and meta-analysis of randomized controlled trials. Nutr Rev 79, 66–75. https://doi.org/10.1093/NUTRIT/NUAA104.
43. Liao, C. De, Tsauo, J.Y., Wu, Y.T., Cheng, C.P., Chen, H.C., Huang, Y.C., Chen, H.C., and Liou, T.H. (2017). Effects of protein supplementation combined with resistance exercise on body composition and physical function in older adults: a systematic review and meta-analysis. Am J Clin Nutr 106, 1078–1091. https://doi.org/10.3945/AJCN.116.143594.
44. Morton, R.W., Murphy, K.T., Mckellar, S.R., Schoenfeld, B.J., Henselmans, M., Helms, E., Aragon, A.A., Devries, M.C., Banfield, L., Krieger, J.W., et al. (2018). A systematic review, meta-analysis and meta-regression of the effect of protein supplementation on resistance training-induced gains in muscle mass and strength in healthy adults. Br J Sports Med 52, 376–384. https://doi.org/10.1136/BJSPORTS-2017-097608.
45. Refalo, M.C., Trexler, E.T., and Helms, E.R. (2025). Effect of Dietary Protein on Fat-Free Mass in Energy Restricted, Resistance-Trained Individuals: An Updated Systematic Review with Meta-Regression. Strength Cond J. https://doi.org/10.1519/SSC.0000000000000888.
46. Ten Haaf, D.S.M., Nuijten, M.A.H., Maessen, M.F.H., Horstman, A.M.H., Eijsvogels, T.M.H., and Hopman, M.T.E. (2018). Effects of protein supplementation on lean body mass, muscle strength, and physical performance in nonfrail community-dwelling older adults: a systematic review and meta-analysis. Am J Clin Nutr 108, 1043–1059. https://doi.org/10.1093/AJCN/NQY192.
47. Björkman, M.P., Pilvi, T.K., Kekkonen, R.A., Korpela, R., and Tilvis, R.S. (2011). Similar effects of leucine rich and regular dairy products on muscle mass and functions of older polymyalgia rheumatica patients: A randomized crossover trial. J Nutr Health Aging 15, 462–467. https://doi.org/10.1007/S12603-010-0276-6.
48. Leenders, M., Verdijk, L.B., Van Der Hoeven, L., Van Kranenburg, J., Nilwik, R., Wodzig, W.K.W.H., Senden, J.M.G., Keizer, H.A., and Van Loon, L.J.C. (2013). Protein Supplementation during Resistance-Type Exercise Training in the Elderly. Med. Sci. Sports Exerc 45, 542–552. https://doi.org/10.1249/MSS.0b013e318272fcdb.
49. Jäger, R., Kerksick, C.M., Campbell, B.I., Cribb, P.J., Wells, S.D., Skwiat, T.M., Purpura, M., Ziegenfuss, T.N., Ferrando, A.A., Arent, S.M., et al. (2017). International Society of Sports Nutrition Position Stand: protein and exercise. J Int Soc Sports Nutr 14, 20. https://doi.org/10.1186/S12970-017-0177-8.
50. Katsanos, C.S., Kobayashi, H., Sheffield-Moore, M., Aarsland, A., and Wolfe, R.R. (2006). A high proportion of leucine is required for optimal stimulation of the rate of muscle protein synthesis by essential amino acids in the elderly. Am J Physiol Endocrinol Metab 291, 381–387. https://doi.org/10.1152/AJPENDO.00488.2005.
51. Moore, D.R., Churchward-Venne, T.A., Witard, O., Breen, L., Burd, N.A., Tipton, K.D., and Phillips, S.M. (2015). Protein Ingestion to Stimulate Myofibrillar Protein Synthesis Requires Greater Relative Protein Intakes in Healthy Older Versus Younger Men. The Journals of Gerontology: Series A 70, 57–62. https://doi.org/10.1093/GERONA/GLU103.
52. Hofmann, M., Schober-Halper, B., Oesen, S., Franzke, B., Tschan, H., Bachl, N., Strasser, E.M., Quittan, M., Wagner, K.H., and Wessner, B. (2016). Effects of elastic band resistance training and nutritional supplementation on muscle quality and circulating muscle growth and degradation factors of institutionalized elderly women: the Vienna Active Ageing Study (VAAS). European Journal of Applied Physiology 2016 116:5 116, 885–897. https://doi.org/10.1007/S00421-016-3344-8.
53. Dzator, S., Weerasekara, I., Shields, M., Haslam, R., and James, D. (2023). Agreement Between Dual-Energy X-ray Absorptiometry and Bioelectric Impedance Analysis for Assessing Body Composition in Athletes: A Systematic Review and Meta-Analysis. Clin J Sport Med 33, 557–568. https://doi.org/10.1097/JSM.0000000000001136.
54. Feng, Q., Bešević, J., Conroy, M., Omiyale, W., Lacey, B., and Allen, N. (2024). Comparison of body composition measures assessed by bioelectrical impedance analysis versus dual-energy X-ray absorptiometry in the United Kingdom Biobank. Clin Nutr ESPEN 63, 214–225. https://doi.org/10.1016/J.CLNESP.2024.06.040.
55. Manole, L.M., Ghiga, G., Iftinchi, O., Boca, L.O., Donos, M.A., Țarcă, E., Ionuț, N., Revenco, N., Margasoiu, I., and Trandafir, L.M. (2025). Bioelectrical Impedance Analysis Versus Dual X-Ray Absorptiometry for Obesity Assessment in Pediatric Populations: A Systematic Review. Diagnostics 15, 1505. https://doi.org/10.3390/DIAGNOSTICS15121505.
56. Paddon-Jones, D., Campbell, W.W., Jacques, P.F., Kritchevsky, S.B., Moore, L.L., Rodriguez, N.R., and Van Loon, L.J.C. (2015). Protein and healthy aging. Am J Clin Nutr 101, 1339S-1345S. https://doi.org/10.3945/AJCN.114.084061.
57. Paddon-Jones, D., and Rasmussen, B.B. (2009). Dietary protein recommendations and the prevention of sarcopenia. Curr Opin Clin Nutr Metab Care 12, 86–90. https://doi.org/10.1097/MCO.0B013E32831CEF8B.
Cite as: https://doi.org/10.32388/substack.o72c0z • PDF
Nice article! Might try to use it to convince my mom who is quite concerned about the kidney disease angle.
I find myself very confused by the Tagawa graphs
Figure 3 - Dose-response relationship between daily protein intake and change in lean body mass. Spline curves were fitted to the data after multivariate adjustment for age, sex, intervention period, and resistance training volume. From left to right: all RCTs, RCTs with resistance training, and RCTs without resistance training are modelled.
Just looking at the graphs, at 3g protein, with resistance training (middle) you get +1.6 kg FFM. But without resistance training you get +2.8 kg FFM. And if you average them out (left)... you get +4kg !
I assume this is due to some differences in the controls but it makes me quite dubious that we can take away anything generalizable or causally actionable from those graphs.