
Never trust The Science™
On the need to identify bias and interpret data yourself

Science starts with a question.
“Which diet is best for preventing cancer?”
“Is climate change killing babies?”
“How did neanderthal DNA get into Eurasian human DNA?”
But before scientists get to answer their question, they need funding. The first bias to make an appearance is funding bias. You see, certain kinds of questions aren’t really allowed to be asked. They’re just not kosher. Favouring certain types of inquiry over others is a fundamentally political choice, not a scientific one, with the downside being that some interesting areas of research are neglected, while other areas get artificially pushed beyond what raw curiosity would have manifested. At its worst, funding bias directly shapes the outcomes of research by presuming and pushing expected results.
Once they’ve secured a grant, the experimentalists then decide how to go about answering said question. But the method(s) we choose can already predispose a certain outcome. For example, failing to control for obvious confounders in observational data is likely to produce biased results. If we like the direction of this bias, we can do less adjustment for confounders. If we don’t like the direction of this bias, we can correct or over-correct for the confounders.
Even with interventional studies, choice of experimental parameters can introduce biases. For example, let’s say I want to study the effects of a high protein diet on muscle mass. In this hypothetical randomised control trial, will I measure lean body mass via dual-energy X-ray absorptiometry or via bioelectrical impedance? If I wanted to bias my trial in favour of the null hypothesis (i.e., that high protein has no effect on muscle mass), then I’d probably go for the less precise measurement (bioelectrical impedance) because it will create a larger spread of datapoints which would require a much higher sample size to be able to prove that a certain effect is statistically significant.1
Once the data have been collected, we then need to analyse the data statistically. More bias seeps in. Wilcoxon or paired t-test? Benjamini-Hochberg or Bonferroni? Can I assume sphericity for my ANOVA? Some of these statistical choices have no obvious right answer—but they’ll give subtly different results nonetheless, so you can pick the one you prefer the outcome of.2
Then we interpret. This means we piece together the results into a coherent narrative. If this means excluding some of the data we collected because it is inconvenient to the narrative, then so be it. We then craft this interpretation into a story that will persuade editors and reviewers at high-impact journals to publish our paper. Storytelling inevitably involves some creative license (otherwise known as bias). And then if editors or reviewers just don’t like the interpretation of the data (it conflicts with their personal biases, say), they’ll just reject it and the world carries on spinning as if the result doesn’t exist (id est, publication bias).
Once it’s gone through all of this, finally the journalists and science communicators get to have their way with it. Abstracts get skimmed and misinterpreted, nuggets of convenient information get stripped of their context and dishonestly propagated, and sometimes claims are made that aren’t anywhere to be found in the actual paper. It’s not just how the science gets reported though, but which science gets reported on in the first place (aka reporting bias). Important but inconvenient studies just don’t get reported on at all, while poor quality studies that point to a favourable conclusion get way more attention than they deserve.
Once you’re savvy to all of this and you get into the habit of reading papers in full (yes—methods and supplementary data too), then these lenses through which the data are distorted become very obvious and you start to see bias everywhere. It’s exhausting, frankly. And the problem is, once a paper gets reported on inaccurately, it can’t then be unreported on. It’s permanent damage done to the realm of public knowledge. Millions of people who typically pride themselves on being informed end up being worse than uninformed—they become enthusiastically misinformed. This means they go about the place confidently wrong because they read about a study on BBC News.
To illustrate this phenomenon, I’d like to discuss a particularly egregious recent example.
“Vegetarian diet lowers risk of cancer, study finds”
The narrative
This was the title of the BBC article reporting on a recent epidemiological study, published in the British Journal of Cancer, which collated data from prior prospective cohort studies looking at the association between peoples’ answers on dietary surveys and their risk of getting various cancers.
The BBC article goes on to discuss the findings with blatantly causal language:
“A vegetarian diet can slash the risk of five types of cancer by as much as 30%, a new study has found.”
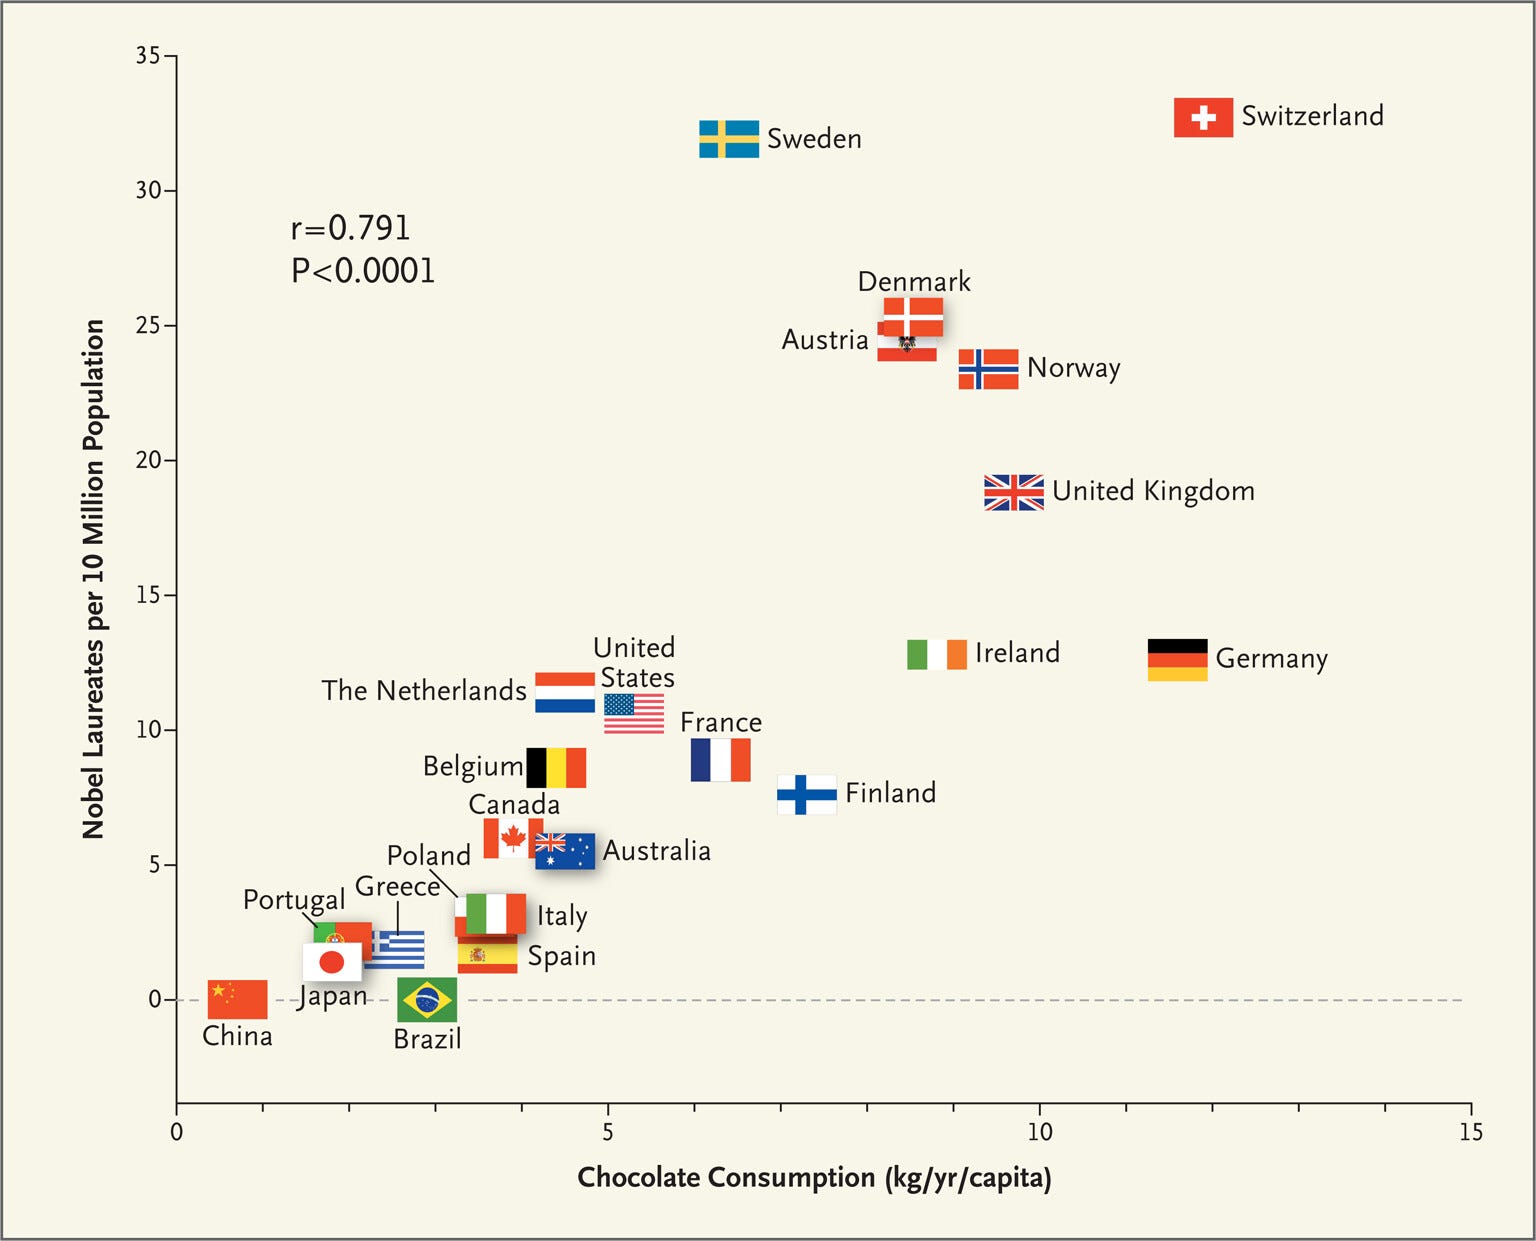
Except there is nothing causal to be inferred here at all. Zero. These are purely observational data. Correlation does not imply causation. Yet this doesn’t stop journalists and scientists pretending otherwise—recall that infamous NEJM study which strongly suggested that higher chocolate consumption causes increased cognitive function.3
The BBC wasn’t alone though. The Independent titled their article “Vegetarian diet can slash the risk of five cancers by as much as 30% – study”. That’s a causal claim, ma’am! Sky News used the same false causal claim for their article. The Guardian was a little better, but went on to include a completely unscientific claim from one of the authors about whether their association is from vegetables being good or meat being bad.
The bias
In case it isn’t obvious, the reason you can’t claim that vegetarian diets “slash” the risk of cancer is because there could be any number of variables that weren’t controlled for (or were over-controlled for) that create this association in the data.4 In the chocolate-Nobel Prize correlation, if you adjust for GDP, the association evaporates (each nation’s wealth is a mediator in this case). For a detailed explanation of why adjusting observational data like this is precarious, I’d recommend this piece:

The intricacies of multivariate adjustment present a kind of statistical bias, but of course there were methodological issues in this study too. The dietary info was acquired via a simple survey—it’s probably not that accurate. In fact, we know it’s not that accurate because the researchers had to filter a lot of junk survey responses out of their data, based on assumptions that are subject to the authors’ biases—they filtered out “unreliable dietary data (more than 80% missing), and those with implausible energy intakes”. Would the results be different if they filtered out data that was 70% missing instead? Probably. This is a huge limitation for all nutrition studies and is probably why so much of the field is pure guff.
Another bit of egregious statistical malpractice here is the failure to report FDR-adjusted p-values. This is very important when you are doing lots of different tests on the same data. If, say, you perform 20 tests (i.e., you look at the outcomes for 20 cancers), then one out of those twenty will give you a p-value less than 0.05 (which is “significant”) purely by chance. In this study, they have 20 cancers being tested across 4 pairwise dietary comparisons. With 80 tests, you’d expect ~4 anomalously significant results. Therefore, it is essential to adjust for multiple comparisons. This can be done in a number of ways. In the paper, they perform Benjamini-Hochberg adjustment, which converts your nominal p-value into an adjusted false discovery rate, sometimes called a q-value. The FDR is inevitably a larger number than the raw p-value (meaning less statistically significant after adjustment).
Now, the paper wouldn’t have been publishable if they didn’t do this. The problem is, whenever they describe their results or present them in forest plots and tables, they claim significance based on nominal p-values! They append the descriptor “FDR significant” to comparisons that are actually significant after adjustment, but they don’t report the numerical adjusted p-values anywhere (even the nominal p-values are hidden in supplementary table 3). They also don’t exactly make it easy to get these data if you wanted to find out yourself …
In their discussion, they are forced to admit the pitfalls of basing their narrative on unadjusted p-values:
“Some of the nominally significant associations observed might be due to chance because of the number of tests performed, but we interpreted all the findings cautiously.”
I guess all the excited journalists missed this sentence.
The actual data
The headline result pushed by both the authors and journalists was that the vegetarian diet was associated with a lower risk of five types of cancer. This is true: comparing vegetarians to meat eaters, the vegetarians in the study had (nominally) significantly lower risks of breast, prostate, kidney, pancreatic, and multiple myeloma cancers. Oll korrect.
Were there any other significant results that were pushed later into the news articles and hidden from the headlines? Erm, does the Pope wear a funny hat?
Compared to meat eaters, vegetarians had almost double the risk of oesophageal squamous cell carcinoma (HR = 1.93, 95% CI: 1.30-2.87). Looking at the vegans there was no protective effect for any cancer and they actually had 40% higher risk of colorectal cancer compared to meat eaters. You’ll note the way these inconvenient findings are brushed under the carpet in many of the news articles on the study.
So which of these “significant” results survives adjustment for multiple comparisons according to the authors?
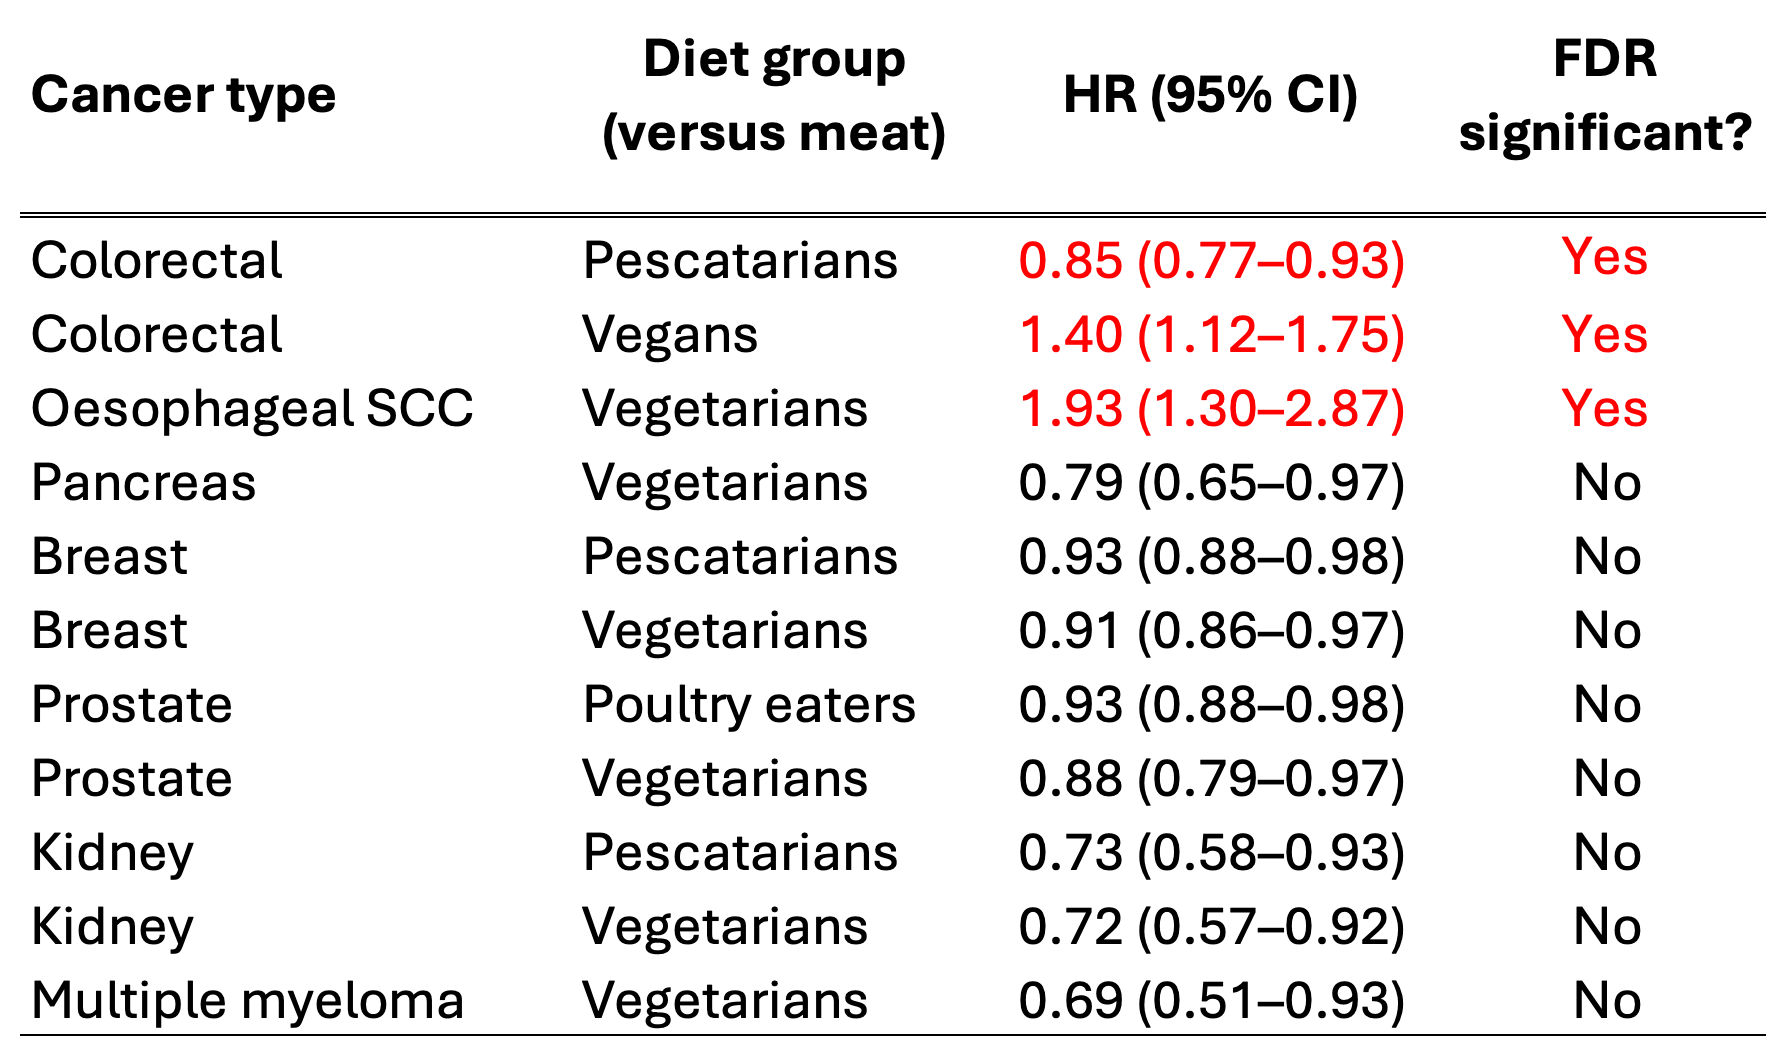
So the only findings that are unlikely to be false discoveries are:
pescatarians had a slightly lower rate of colorectal cancer than meat eaters
vegans had higher rate of colorectal cancer than meat eaters
vegetarians had a drastically higher rate of oesophageal squamous cell carcinoma than meat eaters
Another way to ensure statistical robustness is through something called sensitivity analysis. This basically involves tweaking the setup of the analysis slightly to see if significant results remain significant. If an minor tweak removes significance, its a telltale sign that the result wasn’t significant in the first place, but likely a fluke. Real biology is robust to sensitivity analysis.
The authors of the study carry out sensitivity analysis in two ways: They recalculate the results when
excluding the first four years of follow-up, and
only including never-smokers
Of the original 11 nominally significant findings, they found only two results remained nominally significant with these alterations:
higher oesophageal SCC in vegetarians compared to meat eaters (this result actually got way stronger in the sensitivity analysis—the vegetarians who had never smoked got this cancer almost three times as much as meat eaters who had never smoked)
lower kidney cancer in vegetarians compared to meat eaters.
Every other significant finding disappeared with the sensitivity analysis tweaks.
Taking the sensitivity analysis findings and the multiple comparisons adjustment together, there was only a single truly robust finding from this study: vegetarians had a significantly higher risk of oesophageal squamous cell carcinoma than meat eaters.
This is what the data actually show. You may have noticed that this is pretty much the polar opposite of the narrative pushed in the media. I’m sure you can see my frustration here?!
Going back to the BBC article title, instead of:
“Vegetarian diet lowers risk of cancer, study finds”
it should have read:
“A bunch of vegetarians happened to go on to develop a type of oesophageal cancer more frequently than what would have been expected by chance compared to otherwise similar meat eaters”.
Alas, most journalists and a lot of scientists are statistically illiterate and epistemically inept.
I originally planned on covering three such papers in this article (each relating to one of the scientific questions I posed in the introduction), but I think doing so would be labouring the point. Instead, I’ll leave one of them in the footnotes as an exercise to the reader.5
So what is the average person to do? Well, firstly don’t believe everything you read in the news, but that’s always the case. Then, if you’re interested in science and if you wish to be able to talk about scientific studies to back up your opinions and arguments, being cognizant of all of these biases will in itself immunise you against them to some degree. Learning some stats also probably won’t hurt. Finally, if you want to simply know which Science™ you can trust, I’d recommend finding and following individuals who repeatedly demonstrate competence in statistical methods and scientific interpretation. If in doubt, read the study critically yourself.
I actually wrote a literature review during my PhD on how this exact phenomenon—choice of methodology introducing bias—had influenced how T cell biologists thought T cell receptor signalling worked. The niche-ness of this example relegates it to a footnote here sadly!
Prospective trials overcome this post hoc p-hacking by forcing researchers to declare their statistical methods ahead of time. Still, if you can predict the results somewhat then you can predict which stats tests will help out your desired outcome more.
Yes, the author acknowledged this fallacy, but still pushed his narrative hard: “… it seems most likely that in a dose-dependent way, chocolate intake provides the abundant fertile ground needed for the sprouting of Nobel laureates.”
Here is their list of adjustments:
”Covariates in the multivariable-adjusted models, all coded as categorical variables, were: cigarette smoking (and tobacco chewing in CARRS-1), alcohol intake, regional and sex-specific height categories, BMI, physical activity, history of diabetes, educational status, living with a partner, ethnic group, and for women parity and ever use of hormone replacement therapy. For female-specific cancers, the models were further adjusted for age at menarche, parity and age at first birth combined, menopausal status, and ever use of oral contraceptives. For prostate cancer, we further adjusted for history of prostate-specific antigen (PSA) screening where available.”
Here’s the study: Temperature-related neonatal deaths attributable to climate change in 29 low- and middle-income countries
Here’s some media coverage:
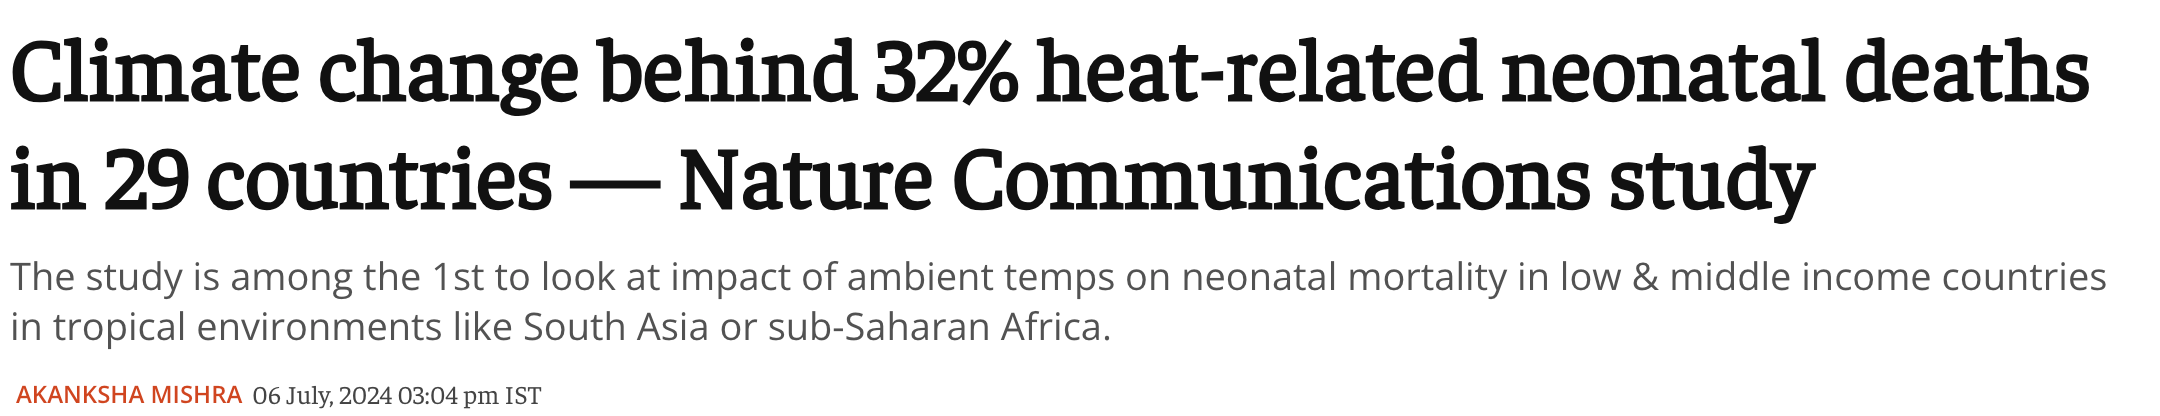
See if you can spot the inconvenient data in the actual study. Hopefully you’ll also get a chuckle out of the x-axis scales of Figure 3c versus d.
Great deep dive into how bad science operates in action. Unfortunately, this kind of thing is more common than not for claims about lifestyle and health. But here is an especially egregious case of a narrative overpowering the data. The only finding worth following up is... that vegetarians have 3x greater risk of esophageal cancers than meat eaters.
I may be weird but I get my Science news by scrolling PubMed, sorting by trending.
So I read the original paper and was not that surprised to see vegetarians getting more cancer. I was vego myself for a number of years and it leads to eating a lot of processed food!
One side-effect of scrolling PubMed is you get a strong sense of how limited science is. Lot of tiny mechanistic studies in vitro. A handful of randomised clinical trials - far fewer than you'd expect - mostly delivering very marginal benefits. Loads and Loads of Reviews. Most work being done on cancer (that's where the money is). And most published papers simply not being worth even a glance.